CarParts.com, Inc. PRTS is slated to release fourth-quarter 2022 results on Mar 7 after market close. The Zacks Consensus Estimate for the to-be-reported quarter’s loss per share and revenues is pegged at 13 cents a share and $152.4 million, respectively.
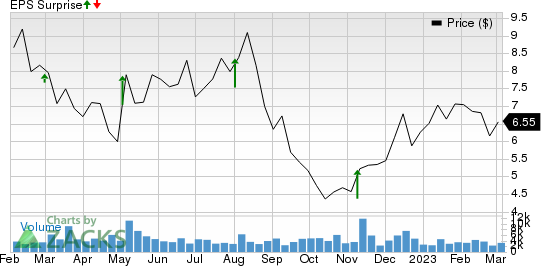
For the fourth quarter, the consensus estimate for PRTS’s loss per share has remained stable in the past 90 days. Its bottom-line estimates imply a deterioration of 30% from the year-ago reported number. The Zacks Consensus Estimate for its quarterly revenues suggests a year-over-year increase of 10.23%. Over the trailing four quarters, PRTS surpassed earnings estimates on all occasions, with the average surprise being 101.25%. This is depicted in the graph below:
CarParts.com, Inc. Price and EPS Surprise

CarParts.com, Inc. price-eps-surprise | CarParts.com, Inc. Quote
Q3 Highlights
In the third quarter of 2022, this U.S.-based online retailer of auto parts and accessories reported an adjusted loss per share of 2 cents, narrower than 9 cents recorded in the prior-year quarter as well as the consensus mark of 8 cents a share. The company reported net sales of $165 million, in line with the Zacks Consensus Estimate and up 16% year over year.
Earnings Whispers
Our proven model does not conclusively predict an earnings beat for CarParts.com for the quarter to be reported as it does not have the right combination of the two key ingredients. A combination of a positive Earnings ESP and a Zacks Rank #1 (Strong Buy), 2 (Buy) or 3 (Hold) increases the odds of an earnings beat. You can uncover the best stocks to buy or sell before they’re reported with our Earnings ESP Filter.
Earnings ESP: PRTS has an Earnings ESP of 0.00%. This is because the Most Accurate Estimate is on par with the Zacks Consensus Estimate.
Zacks Rank: It currently carries a Zacks Rank #3. You can see the complete list of today’s Zacks #1 Rank stocks here.
Factors at Play
Strong demand for the firm’s services and the launch of the company’s Do-It-For-Me program on its website, called Get It Installed, are expected to have driven fourth-quarter sales. Expanded capacity at its Grand Prairie distribution center has not just boosted the inventory of brand partners but also created more space for CarParts.com’s premium brands like TrueDrive, DriveWire, DriveMotive, JC Whitney and SureStop brake product line. This is likely to have boosted CarParts.com revenues in the to-be-reported quarter. Additionally, the company has been successfully passing the rising costs of raw materials to customers through smart pricing actions, which are expected to aid the upcoming results.
On the flip side, high operating expenses for improvement in the company’s online and mobile platforms are likely to have strained near-term margins. Spending on promotional campaigns and innovation may have put pressure on profits. CarParts.com’s selling, general and administration expenses have been on the rise over the few quarters and the trend is anticipated to have continued in the fourth quarter of 2022.
Peer Releases
BorgWarner BWA reported fourth quarter 2022 results on Feb 9. It posted adjusted earnings of $1.26 per share for fourth-quarter 2022, up from $1.06 recorded in the prior-year quarter. The bottom line also beat the Zacks Consensus Estimate of $1.04 per share. Higher-than-anticipated revenues across e-Propulsion & Drivetrain, Fuel-System and Aftermarket segments resulted in the outperformance. The automotive equipment supplier reported net sales of $4,108 million, outpacing the Zacks Consensus Estimate of $3,892 million. The top line also moved up 12.4% year over year.
For full-year 2023, the company anticipates net sales within $16.7-$17.5 billion, indicating year-over-year growth of 7-12%. Importantly, BorgWarner envisions electric vehicle revenues of around $1.5 billion-$1.8 billion for 2023, markedly up from $870 million in 2022. Adjusted operating margin is expected in the band of 8.6-9%. Adjusted net earnings are estimated to be within $4.5-$5 per share. Free cash flow is projected in the band of $550-$650 million.
Magna International MGA reported fourth-quarter 2022 results on Feb 10. It posted adjusted earnings of 91 cents per share, which slumped 30% on a year-over-year basis. The bottom line also lagged the Zacks Consensus Estimate of $1.24 a share. Lower-than-expected EBIT in Body Exteriors & Structures, Power & Vision and Seating Systems segments led to the underperformance. In the reported quarter, net sales increased 5% from the prior-year quarter to $9,568 million, surpassing the consensus mark of $9,473 million.
Magna expects full-year 2023 and 2025 revenues in the band of $39.6-$41.2 billion and $44.7-$47.2 billion, respectively. Adjusted EBIT margins for 2023 and 2025 are forecast in the range of 4.1-5.1% and 6.7-7.8%, respectively. Capital spending and net income attributable to Magna are expected to be $2.4 billion and between $1.1 and $1.4 billion for FY2023, respectively.
Want the latest recommendations from Zacks Investment Research? Today, you can download 7 Best Stocks for the Next 30 Days. Click to get this free report
BorgWarner Inc. (BWA) : Free Stock Analysis Report
Magna International Inc. (MGA) : Free Stock Analysis Report
CarParts.com, Inc. (PRTS) : Free Stock Analysis Report