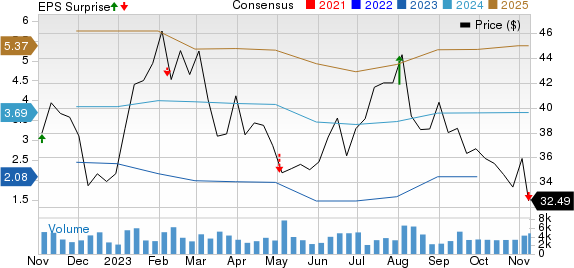
Adient ADNT delivered adjusted earnings per share of 51 cents for the fourth quarter of fiscal 2023. Earnings fell from 53 cents recorded in the year-ago period and also missed the Zacks Consensus Estimate of 52 cents. In the reported quarter, Adient generated net sales of $3,729 million, which increased 2.2% year over year but missed the Zacks Consensus Estimate of $3,760 million.
Adient Price, Consensus and EPS Surprise

Adient price-consensus-eps-surprise-chart | Adient Quote
Segmental Performance
Adient currently operates through three reportable segments — the Americas, including North America and South America; Europe, which includes the Middle East and Africa (“EMEA”); and Asia Pacific/China (Asia).
In the reported quarter, the Americas segment recorded revenues of $1,835 million, an increase of 2.5% from the year-ago period, topping the Zacks Consensus Estimate of $1,776 million. The segment posted an adjusted EBITDA of $100 million, down from $117 million recorded in the prior-year period, but topped the Zacks Consensus Estimate of $93 million, driven by sales outperformance and improved volume and mix.
In the fiscal fourth quarter, the EMEA segment registered revenues of $1,174 million, which increased 6.6% year over year but fell short of the Zacks Consensus Estimate of $1,241 million. The segment recorded EBITDA of $48 million in the quarter under review, higher than $34 million generated in the year-ago period. It also outpaced the Zacks Consensus Estimate of $44.28 million on the back of improved business performance and forex benefits.
In the quarter, revenues in the Asia segment came in at $748 million, down 5.6% year over year, but topped the Zacks Consensus Estimate of $742. The segment’s adjusted EBITDA grew 13% to $113 million on improved business performance and high equity income.
Financial Position
Adient had cash and cash equivalents of $1,110 million as of Sep 30, 2023 compared with $947 million on Sep 30, 2022.
Long-term debt amounted to $2,401 million in the reported quarter, down from $2,564 million as of Sep 30, 2022.
Capital expenditures totaled $75 million in the fiscal fourth quarter of 2023 compared with $57 million in the prior-year quarter.
Outlook 2024
Adient envisions fiscal 2024 revenues in the range of $15.60-15.70 billion. Adjusted EBITDA is estimated to be $1,010 million. Equity income and capex are forecast to be $70 million and $310 million, respectively. Free cash flow is estimated to be $300 million. Interest expenses and cash tax are estimated to be $185 million and $105 million, respectively.
Zacks Rank & Key Picks
ADNT currently carries a Zacks Rank #3 (Hold).
Some top-ranked players in the auto space are Toyota Motor TM, Honda Motor Co., Ltd. HMC and Modine Manufacturing Company MOD, each sporting Zacks Rank #1 (Strong Buy). You can see the complete list of today’s Zacks #1 Rank stocks here.
The Zacks Consensus Estimate for TM’s 2023 sales and earnings implies year-over-year growth of 10.6% and 29.7%, respectively. The EPS estimate for 2023 has increased by 28 cents in the past seven days.
The Zacks Consensus Estimate for HMC’s 2023 sales and earnings suggests year-over-year improvements of 7.7% and 31%, respectively. The EPS estimates for 2023 and 2024 have moved up by 9 cents and 24 cents, respectively, in the past 30 days.
The Zacks Consensus Estimate for MOD’s 2023 sales and earnings indicates year-over-year growth of 6.5% and 55.9%, respectively. The EPS estimates for 2023 and 2024 have increased by 16 cents and 9 cents, respectively, in the past seven days.
Want the latest recommendations from Zacks Investment Research? Today, you can download 7 Best Stocks for the Next 30 Days. Click to get this free report
Toyota Motor Corporation (TM) : Free Stock Analysis Report
Honda Motor Co., Ltd. (HMC) : Free Stock Analysis Report
Modine Manufacturing Company (MOD) : Free Stock Analysis Report
Adient (ADNT) : Free Stock Analysis Report