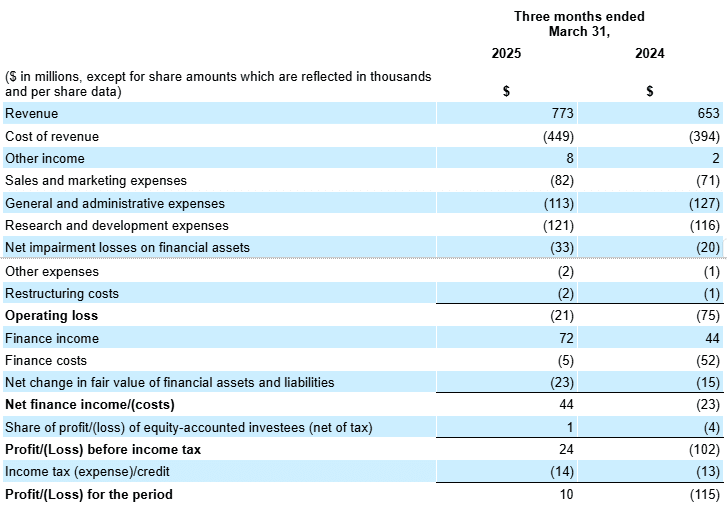
- Revenue grew 18% year-over-year and on a constant currency basis to $773 million
- On-Demand GMV grew 16% year-over-year, or 17% on a constant currency basis to $4.9 billion
- Profit for the quarter improved by $125 million year-over-year to $10 million
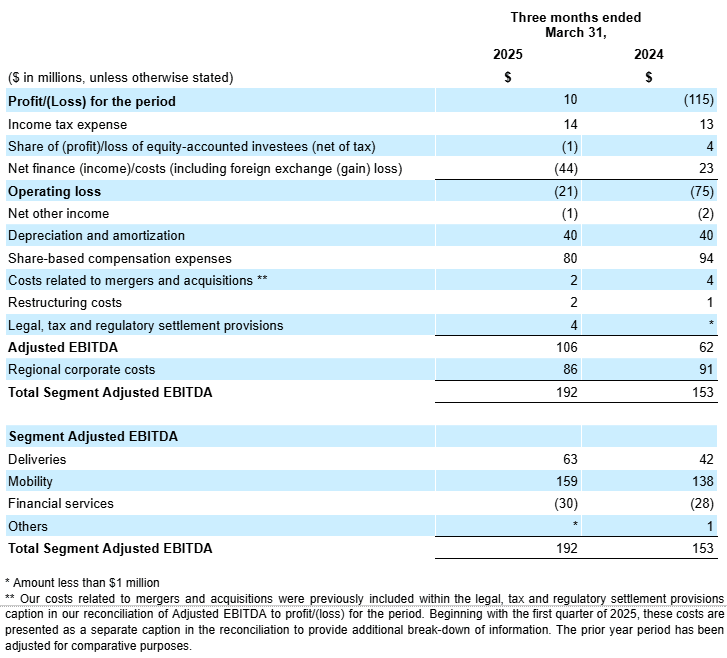
- Adjusted EBITDA improving by $44 million year-over-year to another record high of $106 million
- Operating Cash Flow of $936 million and Adjusted Free Cash Flow of $157 million on a trailing 12-month basis
SINGAPORE, April 30, 2025 – Grab Holdings Limited (NASDAQ: GRAB) today announced unaudited financial results for the first quarter ended March 31, 2025.
“We had a strong set of results to start the year, sustaining robust demand growth momentum to achieve yet another quarterly record number of users on our platform, even amid the seasonal demand impacts from the Lunar New Year and Ramadan fasting period. We also grew the number of active partners on our platform, and now have more active driver- and merchant-partners than ever before,” said Anthony Tan, Group Chief Executive Officer and Co-Founder of Grab. “While we are cognizant that there are increased levels of uncertainty in the global macroeconomic landscape, we will continue to harness AI and our technological capabilities to improve the reliability and affordability of our offerings. This will increasingly position us as a counter-cyclical company that can weather through uncertainties in the macroeconomic landscape.”
“We continued to drive profitable growth across the business, with Grab achieving another quarter of record revenues, our thirteenth consecutive quarter of Adjusted EBITDA expansion, and Adjusted Free Cash Flow scaling to $157 million on a trailing 12-months basis,” said Peter Oey, Chief Financial Officer of Grab. “Looking ahead to the second quarter, we expect to drive strong, sequential On-Demand GMV and overall revenue growth, while remaining disciplined on costs as a company. We are also raising our full year Adjusted EBITDA guidance to a range of $460 million to $480 million.”
Group First Quarter 2025 Key Operational and Financial Highlights
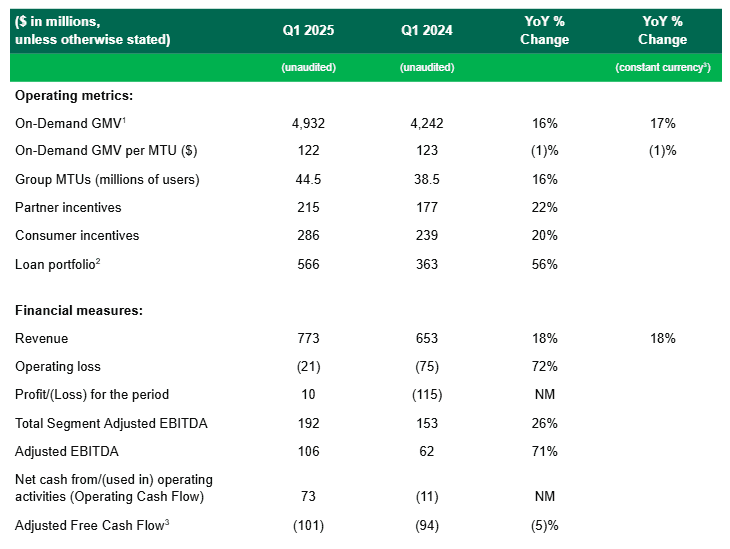
- Revenue grew 18% year-over-year (“YoY”) and on a constant currency basis, with YoY growth accelerating from the prior quarter, to $773 million in the first quarter of 2025, driven by growth across all segments.
- On-Demand GMV grew 16% YoY, or 17% YoY on a constant currency basis to $4.9 billion, underpinned by YoY growth in On-Demand MTUs and total number of On-Demand transactions of 18% and 21% respectively.
- Total incentives were $501 million in the first quarter of 2025, with On-Demand incentives as a proportion of On-Demand GMV at 10.1%, compared to 9.7% in the same period in 2024 as we focused on product roll-outs across Mobility and Deliveries to drive new user growth, and improve engagement among existing users.
- Operating loss in the first quarter was $21 million, an improvement of $55 million YoY, primarily driven by increases in revenue and lower share-based compensation expenses.
- Profit for the period was $10 million, an improvement of $125 million YoY, primarily due to reduction in operating loss and higher net finance income for the period, which includes $33 million of net foreign exchange gains.
- Adjusted EBITDA was $106 million for the quarter, an improvement of $44 million YoY from $62 million in the prior year period, as we grew On-Demand GMV and revenue, while improving profitability on a Segment Adjusted EBITDA basis and lowering regional corporate costs4.
- Regional corporate cost4 for the quarter was $86 million, improving from $91 million in the prior year period and remaining relatively stable from $87 million in the fourth quarter of 2024. On a year-on-year basis, fixed costs within regional corporate costs reduced by 5%.
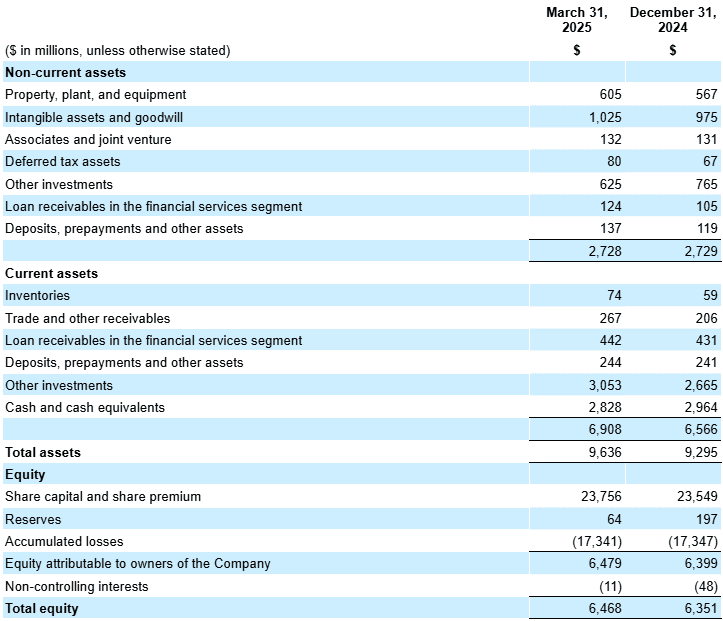
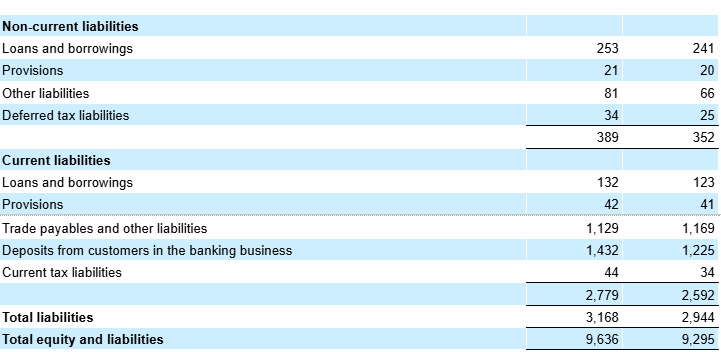
- Cash liquidity5 totaled $6.2 billion at the end of the first quarter, compared to $6.1 billion at the end of the prior quarter, with a substantial part of the cash inflow attributed to the continued growth in deposits from customers in the banking business, which increased to $1,432 million from $1,225 million from the prior quarter. Our net cash liquidity6 was $5.9 billion at the end of the first quarter, compared to $5.8 billion at the end of the prior quarter.
- As of March 31, 2025, a balance of $274 million out of the previously approved $500 million share repurchase program remained available to be deployed.
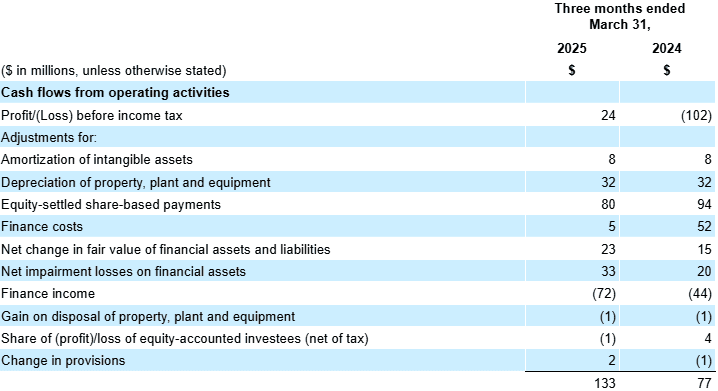
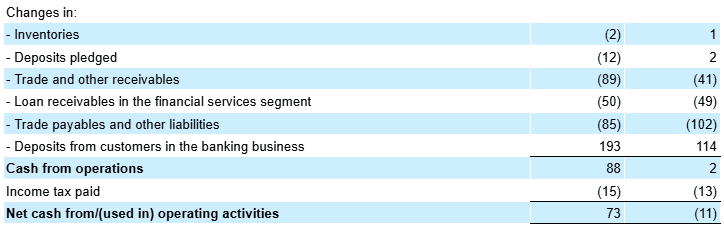
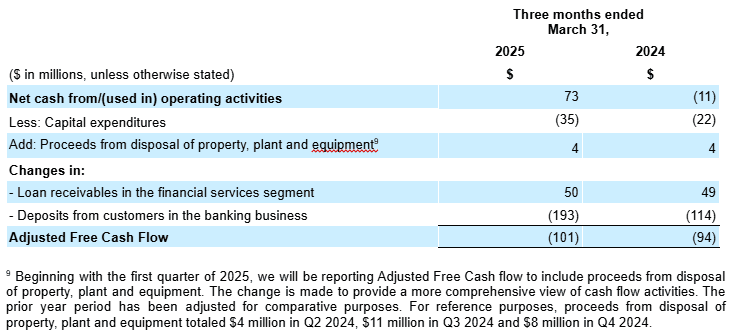
- Net cash from operating activities was $73 million in the first quarter of 2025, an improvement of $84 million YoY, driven by profit before income tax compared to a loss in the same period last year, and an increase in deposits from customers in the banking business. Adjusted Free Cash Flow3 was negative $101 million during the quarter, declining $7 million YoY due to higher working capital outflows, consistent with seasonal trends during the first quarter, and increases in capital expenditures.
- In April 2025, we published our 2024 ESG report7 where we shared more about the progress we have made on our commitment to our environmental, social, and governance priorities. Our key ESG highlights in 2024 include $12.8 billion earned by driver- and merchant-partners on the Grab platform, a 16% increase YoY, and recording 99.9% of all rides occurring without any safety incidents.
Business Outlook
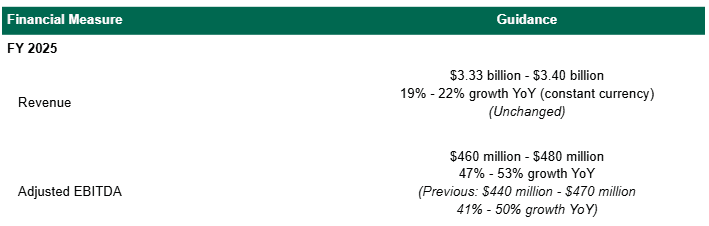
The above updated guidance and expected year-over-year growth is primarily attributable to the organic expansion of our business, and represents our expectations as of the date of this press release and may be subject to change.
Segment Financial and Operational Highlights
Deliveries
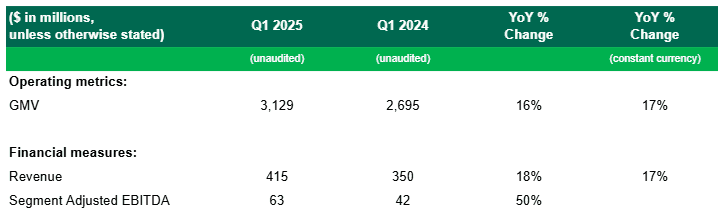
- Deliveries revenue grew 18% YoY, or 17% YoY on a constant currency basis, to $415 million in the first quarter of 2025. The strong growth was primarily driven by growth in Deliveries GMV and increased contributions from our Advertising business.
- Deliveries GMV grew 16% YoY, or 17% YoY on a constant currency basis, to $3,129 million in the first quarter of 2025, driven by an increase in the total number of Deliveries transactions and Deliveries MTUs. Even though the first quarter is seasonally the softest quarter of the year, Deliveries MTUs grew 17% YoY to reach a new record high, signalling our expanding value proposition to a wider segment of users.
- Deliveries segment adjusted EBITDA as a percentage of GMV was 2.0% in the first quarter of 2025, improving by 46 basis points from 1.6% in the prior year period. This was primarily driven by increased contributions from Advertising and improvements to operating leverage.
- During the first quarter, the total number of monthly active advertisers who joined our self-serve platform increased 49% YoY to 191,000 while average spend by monthly active advertisers on our self-serve platform increased 30% YoY, as we continued to deepen Advertising penetration among our merchant-partners. Advertising revenue as a percentage of Deliveries GMV continued to expand to 1.7% in the first quarter from 1.3% in the prior year period and stable from the fourth quarter of 2024.
- GrabMart grew strongly during the first quarter of 2025, registering GMV growth rates that were faster than the overall Deliveries segment. We continued to onboard more merchants onto our ecosystem to expand selection for our users, and deepen our existing partnerships. We were also able to take advantage of the shifts in consumer preference from dining out and food deliveries to home-cooking during Ramadan, to drive strong demand growth for GrabMart during the festival, with GrabMart GMV in March hitting a new monthly record.
Mobility
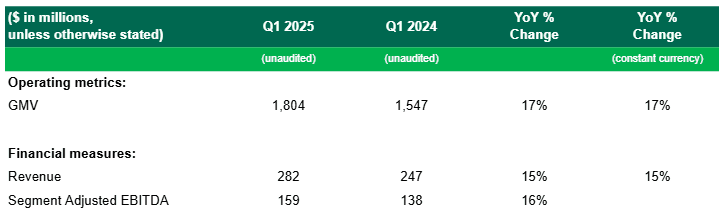
- Mobility revenue grew 15% YoY and on a constant currency basis in the first quarter of 2025. Growth was underpinned by strong growth in Mobility MTUs and total number of Mobility transactions. Notably, Mobility MTUs and total number of Mobility transactions grew 20% and 25% YoY respectively.
- Mobility GMV grew 17% YoY and on a constant currency basis to $1,804 million during the quarter.
- Mobility segment adjusted EBITDA as a percentage of Mobility GMV was 8.8% in the first quarter of 2025, compared to 8.9% in the same period last year.
- We continued to increase active driver supply while optimizing our existing driver supply to meet growing demand for our services. During the quarter, total monthly active drivers increased 18% YoY and 4% quarter-over-quarter (“QoQ”), while driver retention rates remained stable at 90%. Our efforts to improve driver supply resulted in a 10 percentage point reduction YoY in the proportion of surged Mobility rides8.
- In Singapore, the Land Transport Authority awarded GrabCab, a subsidiary of our rentals business GrabRentals, a street-hail operator license. By improving the supply of vehicles on our platform, we can also improve the efficiency of our marketplace for our passengers. Additionally, we plan to launch a fully green GrabCab fleet, featuring low- and zero-emission hybrid and electric vehicles.
- In March 2025, we announced the signing of new Memoranda of Understanding (MoUs) with four autonomous technology companies: Autonomous A2Z, Motional, WeRide and Zelos. These partnerships aim to explore the impact and potential role of autonomous vehicles within Southeast Asia’s transportation landscape.
Financial Services
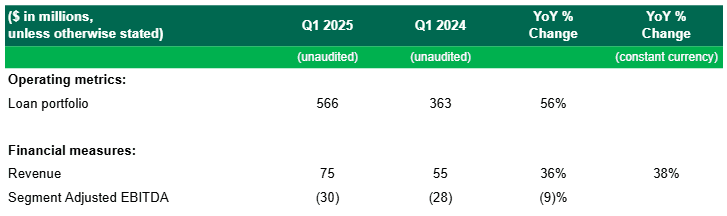
- Revenue for Financial Services grew 36% YoY, or 38% YoY on a constant currency basis, to $75 million in the first quarter of 2025. The YoY growth was primarily driven by increased contributions mainly from lending across GrabFin and Digibanks, and further optimization of payments incentive spend.
- Segment adjusted EBITDA losses for the quarter increased by 9% YoY to negative $30 million, with an increase in expected credit loss provisions as we continued to increase our loan disbursals. We continued to maintain a prudent stance on credit risk, with 90-days non-performing loans within our risk appetite.
- We continued to focus on lending to our ecosystem partners through GrabFin and our Digibanks, with total loans disbursed growing by 30% YoY to $630 million during the first quarter. Our total loan portfolio outstanding at the end of the first quarter grew 56% YoY to $566 million from $363 million in the prior year period.
- Customer deposits in GXS Bank (Singapore) and GX Bank (Malaysia) grew strongly to $1,432 million in the first quarter from $479 million in the prior year period and from $1,225 million in the prior quarter. We are able to achieve continued growth on a QoQ and YoY basis for our deposit-base, highlighting the strength of the Digibanks’ ability to leverage the Grab ecosystem.
Others
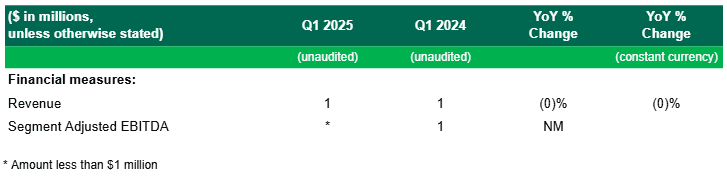
- Revenue for Others was $1 million in the first quarter of 2025.
1 We consider Mobility and Deliveries segments to represent our On-Demand businesses. On-Demand GMV is defined as the sum of Mobility and Deliveries GMV.
2 The total of current and non-current loan receivables in the financial services segment, net of expected credit loss allowances.
3 Beginning with the first quarter of 2025, we will be reporting Adjusted Free Cash flow to include proceeds from disposal of property, plant and equipment. For reference purposes, proceeds from disposal of property, plant and equipment totaled $4 million in Q2 2024, $11 million in Q3 2024 and $8 million in Q4 2024.
4 Regional corporate costs are costs that are not attributed to any of the business segments, including certain cost of revenue, research and development expenses, general and administrative expenses and marketing expenses. These regional costs of revenue include cloud computing costs. These regional research and development expenses also include mapping and payment technologies and support and development of the internal technology infrastructure. These general and administrative expenses also include certain shared costs such as finance, accounting, tax, human resources, technology and legal costs. Regional corporate costs exclude share-based compensation expenses and capitalized software costs.
5 Cash liquidity includes cash on hand, short-term and long-term time deposits, marketable securities and restricted cash.
6 Net cash liquidity includes cash liquidity less loans and borrowings.
7 Except for the details specifically mentioned in this earnings release, the contents of our 2024 ESG report do not constitute a part of, and shall not be deemed incorporated by reference into, this earnings release.
8 Surged Mobility rides are defined as completed rides where demand exceeds supply in a specified region and/or where pricing regulations adherence is required.
About Grab
Grab is a leading superapp in Southeast Asia, operating across the deliveries, mobility and digital financial services sectors. Serving over 800 cities in eight Southeast Asian countries – Cambodia, Indonesia, Malaysia, Myanmar, the Philippines, Singapore, Thailand and Vietnam – Grab enables millions of people everyday to order food or groceries, send packages, hail a ride or taxi, pay for online purchases or access services such as lending and insurance, all through a single app. Grab was founded in 2012 with the mission to drive Southeast Asia forward by creating economic empowerment for everyone. Grab strives to serve a triple bottom line – we aim to simultaneously deliver financial performance for our shareholders and have a positive social impact, which includes economic empowerment for millions of people in the region, while mitigating our environmental footprint.
We use our website as a means of disclosing material information about our company. Such disclosures will be included on our website in the “Investor Relations” section or at investors.grab.com. Accordingly, investors should monitor such sections of our website, in addition to following our press releases, SEC filings and public conference calls and webcasts. Information contained on, or that can be accessed through, our website does not constitute a part of this document and is not incorporated by reference herein.
Forward-Looking Statements
This document and the announced investor webcast contain “forward-looking statements” within the meaning of the “safe harbor” provisions of the U.S. Private Securities Litigation Reform Act of 1995. All statements other than statements of historical fact contained in this document and the webcast, including but not limited to, statements about Grab’s goals, targets, projections, outlooks, beliefs, expectations, strategy, plans, objectives of management for future operations of Grab, and growth opportunities, are forward-looking statements. Some of these forward-looking statements can be identified by the use of forward-looking words, including “anticipate,” “expect,” “suggest,” “plan,” “believe,” “intend,” “estimate,” “target,” “project,” “should,” “could,” “would,” “may,” “will,” “forecast,” “annualized run-rate” or other similar expressions. Forward-looking statements are based upon estimates and forecasts and reflect the views, assumptions, expectations, and opinions of Grab, which involve inherent risks and uncertainties, and therefore should not be relied upon as being necessarily indicative of future results. A number of factors, including macro-economic, industry, business, regulatory and other risks, could cause actual results to differ materially from those contained in any forward-looking statement, including but not limited to: Grab’s ability to grow at the desired rate or scale and its ability to manage its growth; its ability to further develop its business, including new products and services; its ability to attract and retain partners and consumers; its ability to compete effectively in the intensely competitive and constantly changing market; its ability to continue to raise sufficient capital; its ability to reduce net losses and the use of partner and consumer incentives, and to achieve profitability; potential impact of the complex legal and regulatory environment on its business; its ability to protect and maintain its brand and reputation; general economic conditions, in particular as a result of currency exchange fluctuations and inflation; expected growth of markets in which Grab operates or may operate; and its ability to defend any legal or governmental proceedings instituted against it. In addition to the foregoing factors, you should also carefully consider the other risks and uncertainties described under “Item 3. Key Information – D. Risk Factors” and in other sections of Grab’s annual report on Form 20-F for the year ended December 31, 2024, as well as in other documents filed by Grab from time to time with the U.S. Securities and Exchange Commission (the “SEC”).
Forward-looking statements speak only as of the date they are made. Grab does not undertake any obligation to update any forward-looking statement, whether as a result of new information, future developments, or otherwise, except as required under applicable law.
Unaudited Financial Information
Grab’s unaudited selected financial data for the three months ended March 31, 2025 and 2024 included in this document and the investor webcast is based on financial data derived from Grab’s management accounts that have not been reviewed or audited.
Certain amounts and percentages that appear in this document may not sum due to rounding.
Non-IFRS Financial Measures
This document and the investor webcast include references to non-IFRS financial measures, which include: Adjusted EBITDA, Segment Adjusted EBITDA, Segment Adjusted EBITDA margin, Total Segment Adjusted EBITDA, Adjusted EBITDA margin, Adjusted Free Cash Flow, cash liquidity and net cash liquidity. Grab uses Adjusted EBITDA, Segment Adjusted EBITDA, Segment Adjusted EBITDA margin, Total Segment Adjusted EBITDA, and Adjusted EBITDA margin for financial and operational decision-making and as a means to evaluate period-to-period comparisons, and Grab’s management believes that these non-IFRS financial measures provide meaningful supplemental information regarding its performance by excluding certain items that may not be indicative of its recurring core business operating results. For example, Grab’s management uses Total Segment Adjusted EBITDA as a useful indicator of the economics of Grab’s business segments, as it does not include regional corporate costs. Adjusted Free Cash Flow excludes the effects of the movement in working capital for our lending and digital banking deposit activities. Grab uses Adjusted Free Cash Flow to monitor business performance and assess its cash flow activity other than its lending and digital banking deposit activities, and Grab’s management believes that the additional disclosure serves as a useful indicator for comparison with the cash flow reporting of certain of its peers. Grab uses cash liquidity and net cash liquidity to assess our ability to meet short-term obligations and invest in growth opportunities.
However, there are a number of limitations related to the use of non-IFRS financial measures, and as such, the presentation of these non-IFRS financial measures should not be considered in isolation from, or as an alternative to, financial measures determined in accordance with IFRS. In addition, these non-IFRS financial measures may differ from non-IFRS financial measures with comparable names used by other companies. See below for additional explanations about the non-IFRS financial measures, including their definitions and a reconciliation of these measures to the most directly comparable IFRS financial measures. With regard to forward-looking non-IFRS guidance and targets provided in this document and the investor webcast, Grab is unable to provide a reconciliation of these forward-looking non-IFRS measures to the most directly comparable IFRS measures without unreasonable efforts because the information needed to reconcile these measures is dependent on future events, many of which Grab is unable to control or predict.
Explanation of non-IFRS financial measures:
- Adjusted EBITDA is calculated as profit (loss) for the period adjusted to exclude: (i) net finance income (costs), including interest income (expenses), foreign exchange gain (loss) and changes in fair value of financial assets and liabilities, (ii) net other income (expenses), (iii) income tax expenses (credit), (iv) depreciation and amortization, (v) share-based compensation expenses, (vi) costs related to mergers and acquisitions, (vii) impairment losses on goodwill and non-financial assets, (viii) restructuring costs (ix) legal, tax and regulatory settlement provisions, and (x) other items not indicative of our ongoing operating performance.
- Segment Adjusted EBITDA represents the Adjusted EBITDA of each of our four business segments, excluding, in each case, regional corporate costs.
- Segment Adjusted EBITDA margin is calculated as Segment Adjusted EBITDA divided by Gross Merchandise Value. For Financial Services and Others, Segment Adjusted EBITDA margin is calculated as Segment Adjusted EBITDA divided by Revenue.
- Total Segment Adjusted EBITDA represents the sum of Adjusted EBITDA of our four business segments.
- Adjusted EBITDA margin is calculated as Adjusted EBITDA divided by Revenue.
- Adjusted Free Cash Flow is defined as net cash flows from operating activities less capital expenditures (including assets acquired under lease arrangements), plus proceeds from disposal of property, plant and equipment, and excluding changes in working capital related to loans and advances to customers, and deposits from the digital banking business.
- Cash liquidity includes cash on hand, short-term and long-term time deposits, marketable securities and restricted cash.
- Net cash liquidity includes cash liquidity less loans and borrowings.
We compare the percent change in our current period results from the corresponding prior period using constant currency. We present constant currency growth rate information to provide a framework for assessing how our underlying GMV and revenue performed excluding the effect of foreign currency rate fluctuations. We calculate constant currency by translating our current period financial results using the corresponding prior period’s monthly exchange rates for our transacted currencies other than the U.S. dollar.
Operating Metrics
Gross Merchandise Value (GMV) is an operating metric representing the sum of the total dollar value of transactions from Grab’s products and services, including any applicable taxes, tips, tolls, surcharges and fees, over the period of measurement. GMV includes (i) sales made through offline stores reported under the deliveries segment; and (ii) revenues made from products and services provided to driver-partners, merchant-partners and other customers to support their businesses, such as GrabAds and GrabRentals, reported under the deliveries and/or mobility segment, as applicable. Mobility GMV is an operating metric representing the GMV of our Mobility segment. Deliveries GMV is an operating metric representing the GMV of our Deliveries segment. On-Demand GMV is an operating metric defined as the sum of Mobility GMV and Deliveries GMV. GMV is a metric by which Grab understands, evaluates and manages its business, and Grab’s management believes is necessary for investors to understand and evaluate its business. GMV provides useful information to investors as it represents the amount of customer spend that is being directed through Grab’s platform. This metric enables Grab and investors to understand, evaluate and compare the total amount of customer spending that is being directed through its platform over a period of time. Grab presents GMV as a metric to understand and compare, and to enable investors to understand and compare, Grab’s aggregate operating results, which captures significant trends in its business over time.
Monthly Transacting User (MTUs) is defined as the monthly number of unique users who transact via Grab’s apps, where transact means to have successfully paid for or utilized any of Grab’s products or services (including lending and offline Jaya Grocer transactions where users record their Jaya Grocer loyalty points on the Grab app). MTUs over a quarterly or annual period are calculated based on the average of the MTUs for each month in the relevant period. MTUs is a metric by which Grab understands, evaluates and manages its business, and Grab’s management believes is necessary for investors to understand and evaluate its business.
Partner incentives is an operating metric representing the dollar value of incentives granted to driver- and merchant-partners, the effect of which is to reduce revenue. For certain delivery offerings where Grab is contractually responsible for delivery services provided to end-users, incentives granted to driver-partners are recognized in cost of revenue.
Consumer incentives is an operating metric representing the dollar value of discounts and promotions offered to consumers, the effect of which is to reduce revenue. Partner incentives and consumer incentives are metrics by which we understand, evaluate and manage our business, and we believe are necessary for investors to understand and evaluate our business. We believe these metrics capture significant trends in our business over time.
Loan portfolio is an operating metric representing the total of current and non-current loan receivables in the financial services segment, net of expected credit loss allowances.
Industry and Market Data
This document may contain information, estimates and other statistical data derived from third party sources, including research, surveys or studies, some of which are preliminary drafts, conducted by third parties, information provided by customers and/or industry or general publications. Such information involves a number of assumptions and limitations due to the nature of the techniques and methodologies used in market research, and as such neither Grab nor the third-party sources can guarantee the accuracy of such information. You are cautioned not to give undue weight to such estimates. Grab has not independently verified such third-party information, and makes no representation as to the accuracy of such third-party information.
Unaudited Summary of Financial Results
Condensed consolidated statement of profit or loss and other comprehensive income
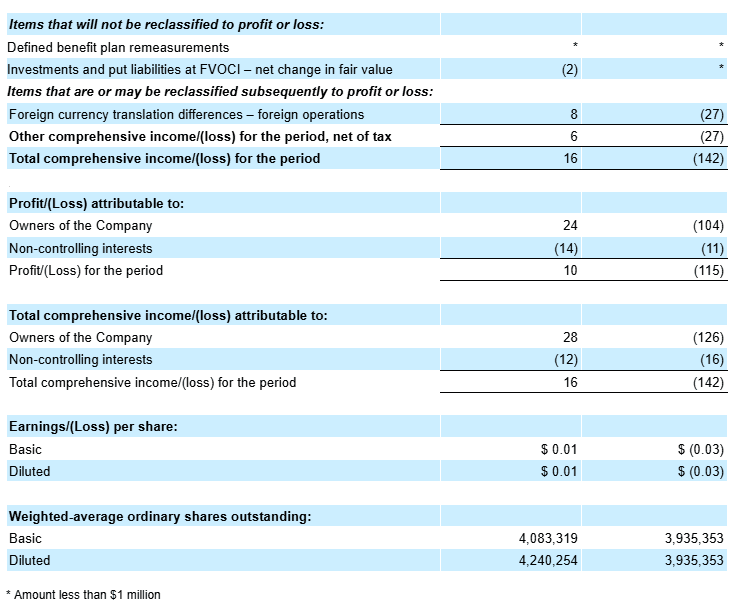
The number of outstanding Class A and Class B ordinary shares was 4,004 million and 120 million as of March 31, 2025, and 3,840 million and 113 million, respectively, as of March 31, 2024. Additionally, 220 million and 379 million potentially dilutive securities have been considered for the computation of diluted earnings per ordinary share for the three months ended March 31, 2025 and 2024 respectively.
Condensed consolidated statement of financial position
Condensed consolidated statement of cash flows