Understanding Uber’s Share of Driver Earnings
One of the most common questions we hear — from drivers, riders, and the public — is: How much of what riders pay for each Uber trip goes to the driver, and how much does Uber keep?
Over nearly a decade of losses, many observers suggested Uber would never be profitable. Now that we are, those same skeptics assert that Uber’s financial improvement must have come at drivers’ expense: in other words, the only reason Uber was able to become profitable was by raising prices while taking an ever larger share of the pie.
This is false.

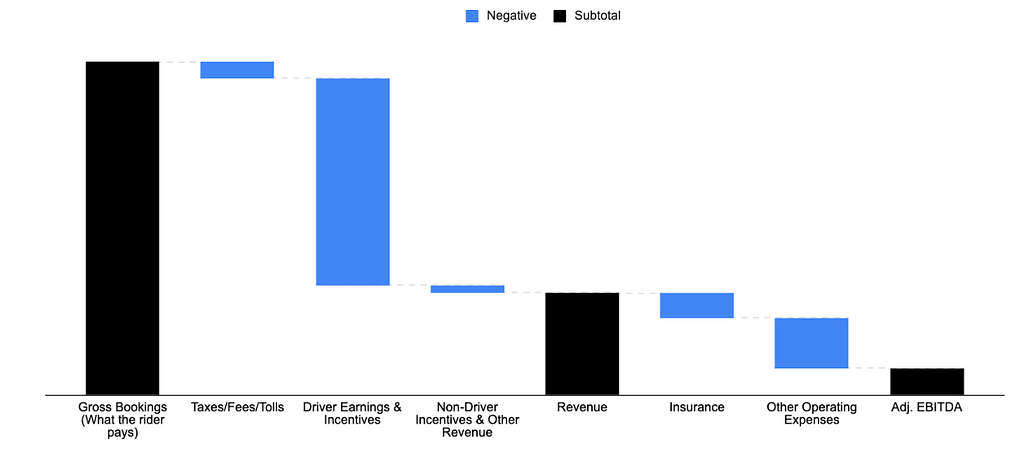
To better understand why, it’s useful to start with an overview of where the money goes after a rider pays for a ride by looking at the financials for our global Mobility business:
In Q3 2025, out of the total amount that riders paid for their rides, recorded as Gross Bookings in our financial statements, the vast majority went to driver earnings, and a much smaller portion went to Uber as Revenue.
The portion going to Uber pays for all of our costs to build, operate, and improve our apps and platform, such as payment processing fees, background checks, marketing, R&D, and customer support. By far the largest cost is commercial insurance (more on that below). Generally speaking, for every dollar in Gross Bookings per trip, Uber’s actual profits are just a few cents — but at our scale, those cents add up.
How much of the fare goes to Uber?
In the past, Uber’s Mobility “take,” or the share it keeps from rider fares, could be roughly seen by comparing GAAP Mobility Revenue to Gross Bookings, which is referred to as Revenue Margin. This metric can continue to be calculated, but business model changes in certain countries as well as accounting changes make looking at this number over time rather confusing.
To get a clearer picture of Uber’s global share of rider fares, you can subtract Platform Participant direct transaction costs from Revenue and divide by Gross Bookings. Uber’s Mobility Revenue Margin overall is 31%, but using this calculation — which reflects all payments and incentives to drivers — an accurate “take” of rider payments by Uber is 21% (as of Q3’25). This disclosure is provided in Uber’s quarterly filings.¹
But haven’t prices gone up, with Uber taking more?
Yes, prices have gone up significantly over the last few years. Uber is an open marketplace, which means that prices tend to reflect broader economic conditions as well as the balance of supply and demand for rides. After the pandemic, driver shortages and widespread inflation drove prices on Uber up globally. Third-party taxes and fees (like sales tax, city fees, and airport fees) have increased more than 40% in the last three years as well.
Even as prices have gone up, the portion going to Uber has remained relatively flat — and in recent quarters has been trending slightly down. In other words, while prices have gone up quite a bit, the vast majority of total fares have continued to go where they belong: into drivers’ pockets.

That’s globally. What about in the US?
Looking at the US, when drivers compare the total amount the rider paid against the total amount that they received, they would see that Uber’s take is higher than the global average — but this difference is driven by higher third-party fees and, even more acutely, by the cost of commercial auto insurance.
All 50 states require that rideshare drivers have high-value commercial insurance coverage while driving on Uber, in addition to their personal auto insurance. Uber pays for this extra insurance so drivers don’t have to. In some markets Uber is required to have 30 times the amount of coverage compared to other cars on the road. That adds up to higher costs for customers.
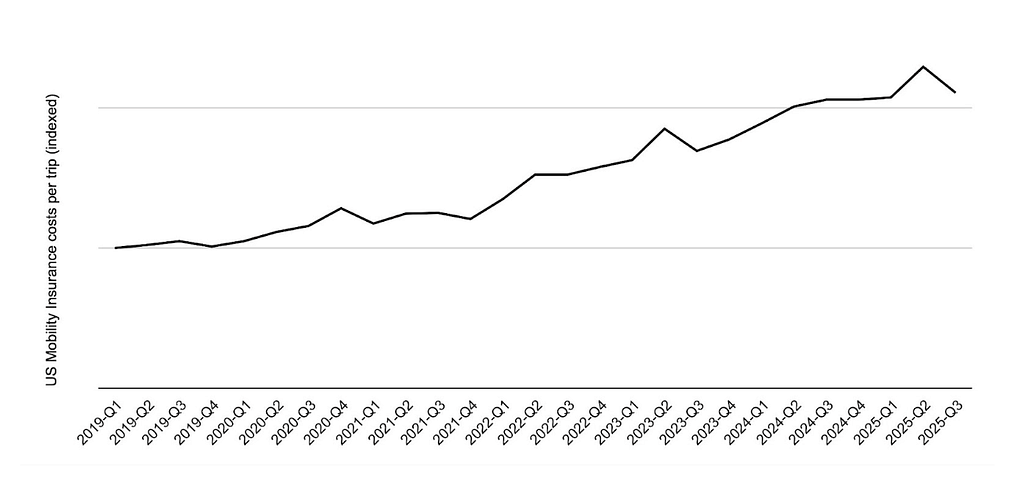
Insurance costs were already high, but they have increased sharply in recent years. Costs associated with Uber’s US rides insurance increased by roughly 50% per trip between 2021 and 2024. In some states, like New Jersey, Uber’s state-mandated insurance costs now account for nearly a third of the costs of an average ride. In Los Angeles, insurance costs are almost half of each fare.
Uber has made the decision to pass some of these growing costs to riders — and not drivers — through increased Booking Fees for each trip, which are spent almost entirely on insurance.
But, as with the global take rate, the service fee that drivers pay to Uber has remained relatively unchanged. So again, even with prices going up, the share going to drivers versus Uber’s true bottom line (after insurance costs) is largely the same.
In fact, if you were to subtract out all of these insurance costs from Uber’s US Mobility Revenue, you would be left with well under 20% of the total fare.
But didn’t Uber cut driver pay?
No. It is true that fares have increased over the last few years — which means more money for drivers. In Q3 of 2025 drivers and couriers on our platform took home a total of $22 billion.
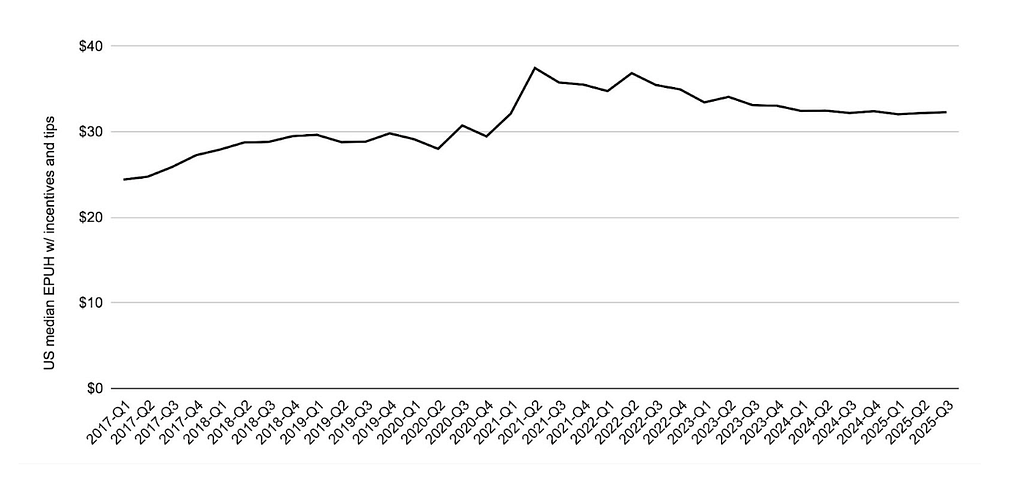
In the US, median driver earnings per utilized hour3, including tips and incentives, are more than $30 an hour.
Additionally, over the last few years, a combination of inflation and increased government-mandated fees (like city surcharges and airport fees) pushed up prices across most markets. Globally, third-party fees have risen almost 50% in the past four years.
So how did Uber suddenly become profitable?
The secret to Uber’s profitability is really no secret at all: as trips on the platform keep reaching new all-time highs, our revenues are growing faster than our costs. It’s a shift that has been long in the making, through steady improvement each quarter. Uber’s Mobility business has been profitable on a segment basis for years. And emerging from the pandemic, our Delivery business (not included in this analysis) skyrocketed into an equally large and now profitable business as well. So as we continue to grow, we are doing so on top of a much more profitable foundation — while investing consistently in improving the driver experience.
How are you helping drivers make sense of all this?

We know that drivers want transparency into how fares are allocated, and we are committed to providing exactly that. Drivers have more insight than ever into fare breakdowns than ever before, and we’ve expanded in-app education to help drivers understand how Uber’s Service Fee funds the technology that power their Uber experience. New tools give drivers — and also riders — a complete picture of fare distribution:
- Trip-level breakdown: Per-trip fare breakdowns are viewable in-app after every trip, so drivers can see how the fare was split.
- Weekly fare breakdowns: The new in-app fare breakdown shows how last week’s fares were divided — driver earnings, Uber’s share, insurance, taxes, and fees — updated every Monday with easy-to-read graphics.
- Rider receipt detail: In many markets in the US we now include information on insurance costs to help riders better understand where their fare is going.
Uber operates an incredibly large and dynamic marketplace, but it only works when it works for all sides. Aligning our interests with drivers’ is a fundamental principle in how we run our platform: we want drivers to be excited, engaged, and choosing Uber. We are also keenly aware that marketplaces that get too greedy with how much they take not only fail to inspire loyalty — they inspire competitors that often replace them. As we continue to grow profitably, we will work to ensure that drivers share in that success.
—
¹ See the Segment information and Geographic information in our 10-K and 10-Q for both revenue and platform participant transaction costs you’d need to subtract.
² Q1’21 excludes a legal accrual that reduced GAAP Mobility revenue by $600 million.
3 We measure earnings per utilized hour — the time drivers spend between accepting and completing a trip — because drivers are free to do as they please in the time between trips. ² ² Many drivers work across multiple apps, so simply having an app open doesn’t mean they are actively working. Drivers are also free to reject as many trips as they want
Understanding Uber’s Share of Driver Earnings was originally published in Uber Under the Hood on Medium, where people are continuing the conversation by highlighting and responding to this story.