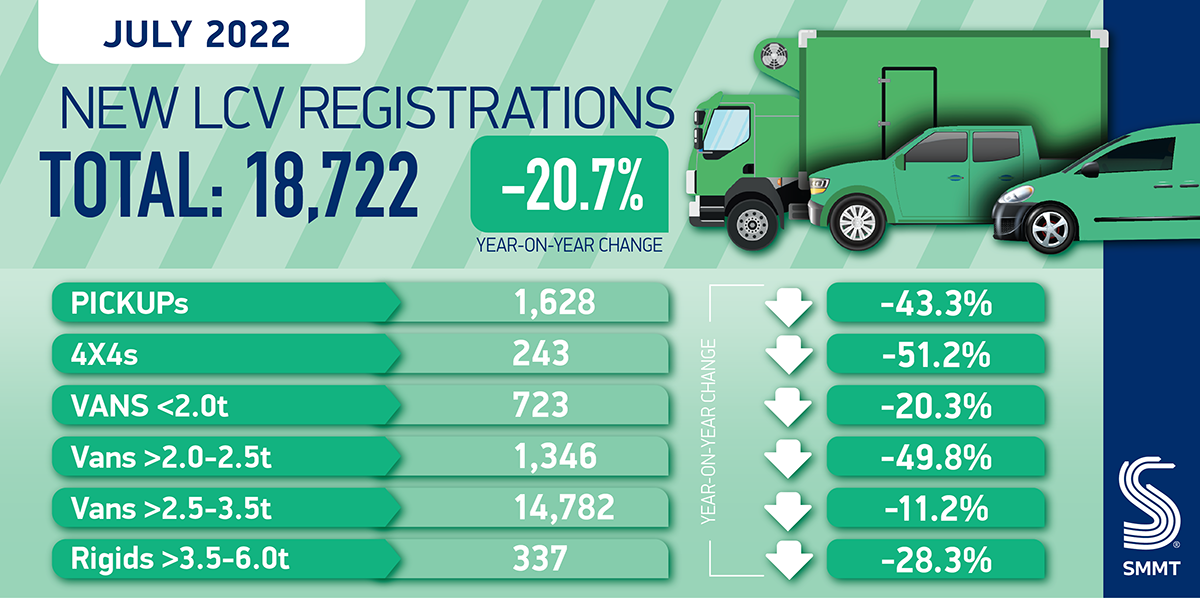
Britain’s light commercial vehicle market falls -20.7% in July, the seventh consecutive month of year-on-year decline, with 18,722 new units registered. Battery electric van (BEV) registrations rise 21.2% in the month and 55.7% in year to date amid industry investment towards Net Zero, but sector’s transition still two years behind cars.1 Industry outlook revised downwards,… Continue reading July LCV market down despite increasing demand for electric vehicles
Category: Trade Body Site
New car registrations fall as supply issues continue to bite
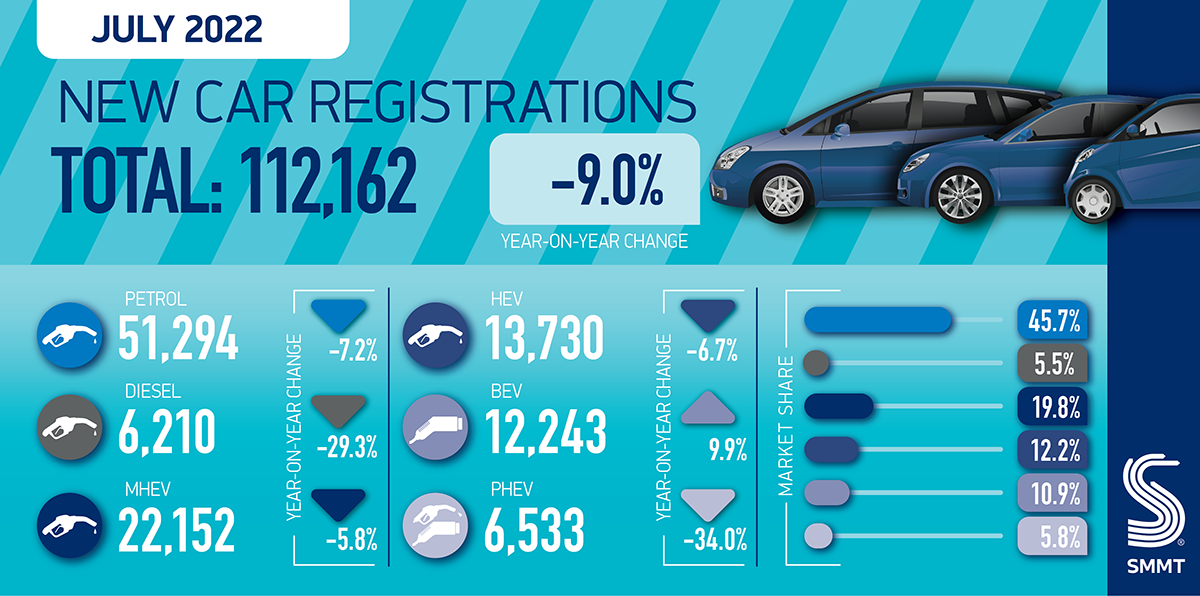
UK new car registrations fall -9.0% to 112,162 units as supply chain shortage continues to frustrate order fulfilment. Battery electric vehicles (BEV) buck trend, growing market share to 10.9%, but pace of growth slows. Industry outlook revised downwards, now anticipating a -2.8% fall in 2022 total new car registrations. SEE CAR REGISTRATIONS BY BRAND DOWNLOAD… Continue reading New car registrations fall as supply issues continue to bite
SALES OF CARS AND LIGHT COMMERCIAL VEHICLES IN JULY 2022
By submitting this information, I give consent to the Association of European Businesses (AEB) (address: 68/70 Butyrsky Val St., Bldg. 1, 4th Floor, Premises I, Room 7, Tverskoy Municipal District, Moscow, 127055 Russian Federation) for the processing (collection, recording, systematization, accumulation, storage, clarification [update, change], extraction, use, transfer [provision, access, entrusting processing] to third parties… Continue reading SALES OF CARS AND LIGHT COMMERCIAL VEHICLES IN JULY 2022
Crashing second-hand market: -18% in July
04.08.2022 The ACI “Auto-Trend” bulletin also photographs the contraction of radiation from the PRA: the turnover of the fleet in circulation is at risk. The used car market is increasingly in crisis: the 226,477 changes of ownership recorded by the Public Automobile Register in July decreased by 18.6% compared to the same month last year.… Continue reading Crashing second-hand market: -18% in July
June 2022 new car pre-registration figures
03 August 2022 #Pre-Registration SMMT released figures for June pre-registrations in the UK new car market. The data shows the number of cars disposed of by vehicle manufacturers in June 2022 that were defined as pre-registrations. Download the June 2022 release Go to Source
SALES OF NEW CONSTRUCTION EQUIPMENT FOR Q 2 & 1H 2022 IN RUSSIA
By submitting this information, I give consent to the Association of European Businesses (AEB) (address: 68/70 Butyrsky Val St., Bldg. 1, 4th Floor, Premises I, Room 7, Tverskoy Municipal District, Moscow, 127055 Russian Federation) for the processing (collection, recording, systematization, accumulation, storage, clarification [update, change], extraction, use, transfer [provision, access, entrusting processing] to third parties… Continue reading SALES OF NEW CONSTRUCTION EQUIPMENT FOR Q 2 & 1H 2022 IN RUSSIA
Car registrations by brand – July 2022
Analysis by brand of car registrations in Italy. Go to Source
Group car registrations – July 2022
Analysis by brand and group of car registrations in Italy. Go to Source
Car and off-road vehicle registrations in Italy: Top 50 models – July 2022
Ranking of the 50 best-selling car models in Italy. Go to Source
Market structure – July 2022
Analysis of the structure of the Italian car market with details by power supply, user, segment, bodywork and geographical area. Go to Source

