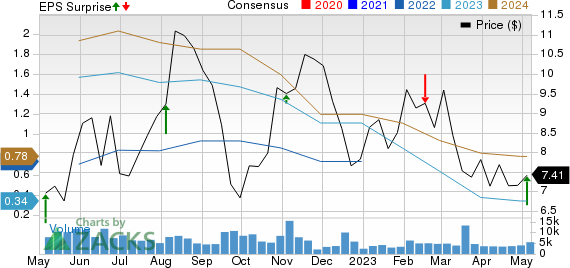
American Axle & Manufacturing Holdings AXL delivered a loss of 1 cent per share in first-quarter 2023, narrower than the Zacks Consensus Estimate’s loss of 6 cents. Higher-than-anticipated sales from the Metal Foaming segment and higher-than-expected adjusted EBITDA in the Driveline segment resulted in the outperformance. However, the bottom line fell from earnings of 19 cents reported in the year-ago quarter. The company generated quarterly revenues of $1,493.9 million, lagging the Zacks Consensus Estimate of $1,517 million. Revenues increased 4.02% on a year-over-year basis, led by contributions from the Tekfor acquisition.
American Axle & Manufacturing Holdings, Inc. Price, Consensus and EPS Surprise

American Axle & Manufacturing Holdings, Inc. price-consensus-eps-surprise-chart | American Axle & Manufacturing Holdings, Inc. Quote
Segmental Performance
In the reported quarter, the Driveline segment recorded sales of $1,013.8 million, falling 3% year over year and missing the Zacks Consensus Estimate of $1,130 million. The segment registered adjusted EBITDA of $114.1 million, declining 7.08% on a year-over-year basis but beating the consensus mark of $107 million.
The company’s Metal Forming business generated revenues of $619.1 million during the quarter, an increase of 17.9% from the year-ago figure and exceeding the consensus estimate of $469 million. The segment witnessed an adjusted EBITDA of $61.3 million, falling 16.4% and lagging the consensus mark of $69 million.
Financial Position
American Axle’s first-quarter SG&A expenses totaled $98.3 million, up from $86.1 million incurred in the prior-year quarter.
Net cash provided by operating activities was $32.1 million, down from $68.5 million in the year-ago period. Capital spending in the quarter was $46.2 million, up from $24.4 million. In the three months ended Mar 31, 2023, the company posted a negative adjusted free cash flow of $17.1 million, down from $53.9 million recorded in the year-earlier period.
In the quarter, American Axle had cash and cash equivalents of $465.7 million compared with $511.5 million on Dec 31, 2022. Its net long-term debt was $2,847.7 million, up from $2,845.1 million as of Dec 31, 2022.
2023 Outlook
American Axle envisions revenues in the range of $5.95-$6.25 billion. The estimate for adjusted EBITDA is in the band of $725-$800 million. Adjusted FCF is expected to be in the range of $225-$300 million, considering capital spending between 3.5% and 4% of sales.
Zacks Rank & Key Picks
AXL currently carries a Zacks Rank #3 (Hold). You can see the complete list of today’s Zacks #1 Rank (Strong Buy) stocks here.
A few top-ranked players in the auto space are Geely Automobile Holdings Limited GELYY, BYD Company Limited BYDDY and Mercedes-Benz Group AG MBGAF, all of which sport a Zacks Rank #1.
Geely is engaged in automobile manufacturing and related areas. The Zacks Consensus Estimates for GELYY’s 2023 sales and earnings imply year-over-year growth of around 57.5% and 7.4%, respectively.
BYD is engaged in the research, development, manufacture and distribution of automobiles, secondary rechargeable batteries and mobile phone components. The Zacks Consensus Estimate for BYDDY’s 2023 sales implies year-over-year increase of around 209.6%.
Mercedes-Benz develops, manufactures and sells passenger cars, including premium and luxury vehicles. The Zacks Consensus Estimate for MBGAF’s 2023 sales implies year-over-year growth of 6%.
Want the latest recommendations from Zacks Investment Research? Today, you can download 7 Best Stocks for the Next 30 Days. Click to get this free report
American Axle & Manufacturing Holdings, Inc. (AXL) : Free Stock Analysis Report
Geely Automobile Holdings Ltd. (GELYY) : Free Stock Analysis Report
Byd Co., Ltd. (BYDDY) : Free Stock Analysis Report
Mercedes-Benz Group AG (MBGAF) : Free Stock Analysis Report