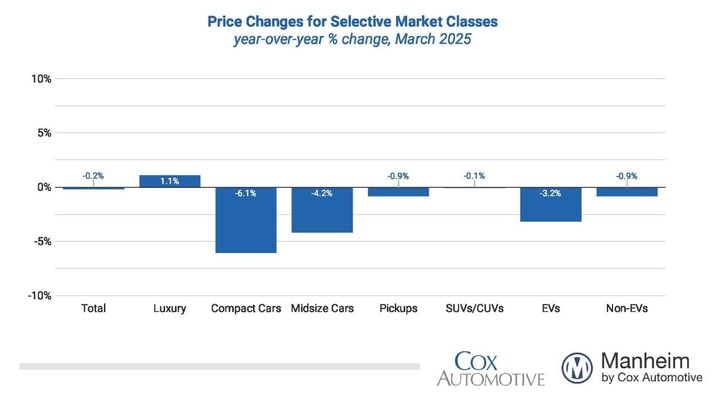

Compared to March 2024, the luxury segment rose the most for the second month in a row, increasing by 1.1%. SUVs also performed better than the industry, declining only 0.1% over the last year.
Graphic: Cox Automotive
The recent spate of automotive-specific tariffs will deeply affect the used-vehicle market regarding sales, inventory and pricing, Cox Automotive reported on April 7.
The new 25% tariffs on all imported vehicles have already disrupted the new vehicle landscape, increasing the urgency among consumers to purchase vehicles before prices increase further. The sudden moves in the new vehicle market will also likely spill into the used vehicle market.
“I think we have officially started our roller coaster ride,” said Cox Automotive chief economist Jonathan Smoke, in a news release. “March used-vehicle values were higher on a non-seasonally adjusted basis, but compared to recent Marches, it did not quite live up to what we’ve seen. And it appeared the “spring bounce” was starting to end. But then suddenly: The tariff announcement. And the most recent activity suggests we will see a sizeable increase in the Index in April.”
Used-vehicle inventory will eventually be affected by new-vehicle tariffs as well. Late in March, used retail inventory trended lower, falling to 2.15 million units, down 1.2% against 2024. Used days’ supply declined by eight days. However, lower supply is mostly typical this time of year, as the used-vehicle market feels its “spring bounce” during tax refund season, resulting in stronger sales and tightening inventory. Inventory will be a key metric to watch in the coming weeks and months.
Expected auto parts and components tariffs will also impact service and reconditioning in the used vehicle market. Skyler Chadwick, director of Product Marketing for Xtime, a Cox Automotive brand devoted to solutions for automotive service departments, noted this: “The typical parts department at a dealership is a United Nations of items, parts from all over the world on the shelves — China, Mexico, Canada, Germany, South Korea, USA. No automaker or brand would be immune to major tariffs at the border. Auto parts are the largest global business. And if auto part prices increase, dealers must manage how much of that added cost can be passed to consumers.”
Manheim Index Declines in March
Wholesale used-vehicle prices (on a mix, mileage, and seasonally adjusted basis) were lower in March compared to February. The Manheim Used Vehicle Value Index (MUVVI) declined to 202.6, which is a decrease of 0.2% from a year ago and also lower than the February levels. The seasonal adjustment caused the index to decline for the month, as non-seasonally adjusted values rose but not enough to account for the normal seasonal move. The non-adjusted price in March increased by 2.7% compared to February, moving the unadjusted average price up 0.4% year over year.
“March is typically the strongest month for wholesale markets, so it’s normal to see values rise. However, this year’s price increases were not enough to meet seasonal expectations, which is why our Index shows a decline,” said Jeremy Robb, senior director of economic and industry insights at Cox Automotive. “Used retail demand remained strong throughout March, with days’ supply ending at low levels, driving healthy activity at Manheim. While we initially thought appreciation trends peaked mid-month, we saw a reacceleration of weekly gains for wholesale values in the last week. Given the impact of tariffs, we may see stronger wholesale prices for the coming weeks as the market decides how to handle new tariffs at the border.”
Wholesale Auto Auction Activity Increases
In March, Manheim Market Report (MMR) values saw price increases for each week in the month, and price appreciation re-accelerated at month end, with values rising 0.3% in the last week. Over the previous four weeks, the Three-Year-Old Index increased an aggregate of 1.2%, which is a bit muted relative to what is typically seen in March. Those same four weeks delivered an average increase of 2.3% between 2014 and 2019, indicating that appreciation trends were weaker than usual.
Over the month, daily MMR Retention, the average difference in price relative to the current MMR, averaged 100.5%, meaning market prices moved above MMR values this month and were also higher against February levels. Compared to last year, valuation models were up by 0.6 percentage points (60 basis points) for MMR retention, but they are five-tenths of a point lower than 2019 levels for the same period.
The average daily sales conversion rate at Manheim rose to 65.8%, an increase of 6 full percentage points against last month and higher than normally seen at this time of year. For comparison, the daily sales conversion rate averaged 60.8% in March over the previous three years.
Major Vehicle Markets See Mixed Trends
Major market segments saw mixed trends for seasonally adjusted prices year over year in March. Compared to March 2024, the luxury segment rose the most for the second month in a row, increasing by 1.1%. SUVs also performed better than the industry, declining only 0.1% over the last year. Underperforming the industry, trucks fell by 0.9%, mid-size sedans were down 4.2%, and compact cars declined the most again, falling by 6.1% against last year.
Compared to the previous month, the luxury segment performed best, moving higher by 0.4%, while SUVs and compact cars were also better than the industry overall, falling by 0.1% and 0.6%, respectively. Faring worse than the industry overall, trucks declined by 0.9% over the month, and mid-size sedans were down the most, falling 1.1%.
Looking at the market by powertrain, electric vehicles (EVs) experienced more depreciation than seen in the last few months as the EV share of all units sold at Manheim hit the highest level on record, at 2.9% of all units. EV values were down 2.3% against February 2025, while non-EVs declined by just 0.4%. For March 2025, EV values are now lower by 3.2% against March 2024, while non-EVs were lower by 0.9% year over year, a bit more than the overall industry average.
As the share of EVs at Manheim grows – a record 2.7% of volume in Q1 – more makes and models of EVs are crossing the lanes at Manheim. There has been an uptick in Tesla volume at auctions, but the share of Teslas sold only made up 39% of the EVs sold at Manheim in the first quarter of 2025, down from 43% in the final quarter of 2024.
Retail Used-Vehicle Sales Up Double Digits in March
Assessing retail vehicle sales based on observed changes in units tracked by vAuto, initial estimates of retail used-vehicle sales in March were up 19.4% compared to February and higher year over year by 8%. During the last four weeks, a used vehicle’s average retail listing price decreased by 2%.
Using estimates of retail used days’ supply based on vAuto data, an initial assessment indicates March ended at 38 days’ supply, down eight days from 46 days at the end of February and down four days from March 2024 at 42 days.
New-vehicle sales in March increased by 10.7% compared to last year, and volume soared 29.9% from a weaker February as consumer interest picked up in the final week of the month, as tariff announcements led many shoppers to buy now rather than wait, fearing higher prices in the future. The March sales pace, or seasonally adjusted annual rate (SAAR), came in at 17.8 million, up 2.1 million from last year’s pace and higher than the 16 million level in February. The March new-vehicle SAAR was the highest in the past four years.
Combined sales into large rental, commercial, and government fleets increased 2.3% year over year in March, driven by an increase in rental fleet sales. Including an estimate for fleet deliveries into dealer and manufacturer channels, the remaining new retail sales were estimated to be up 15.1% from last year, a strong increase that pushed estimated retail SAAR of 15.2 million, up 20.4% from last year’s pace, and also higher than February’s estimated 12.8 million level. Fleet share was estimated to be 16.5%, down from last year’s 19.7% share.
Revised Used and Wholesale Vehicle Market Forecast and Outlook for 2025
As announced last week in its Q1 Industry Insights and Sales Forecast Call, Cox Automotive has revised its 2025 forecasts to account for the impact of tariffs. Cox Automotive is forecasting retail used-vehicle sales in 2025 to reach 20.1 million, an increase of about 1.2% compared to 2024. Sales growth is expected to remain muted, as retail and wholesale supply will continue to be constrained in the coming year due to lower production during the pandemic and fewer lease maturities returning to the market.
With the increased pressure on the cost of new units, used-vehicle values, as measured by the MUVVI, are expected to experience more appreciation in 2025 than usual. Before the announcement of tariffs, the forecast had the Manheim Used Vehicle Value Index ending December 2025 up 1.4% from the end of 2024, slightly below the long-term average rise of 2.3%.
The forecast has been upgraded, given the current state of the used retail supply and the expectation that more consumers will downshift from purchasing a new vehicle to a used vehicle, which implies a larger increase in vehicle values. Pricing volatility is expected over the course of the year, but the latest forecast has the index up at least 2.1% at the end of the year, close to the long-term run rate.
Rental Risk Price and Mileage Results Were Mixed Against Last March
The average price for rental risk units sold at auction in March increased 4.5% year over year. Additionally, rental risk prices rose 3.4% compared to February, the largest monthly gain since March 2023. Average mileage for rental risk units in March (at 49,900 miles) fell 5.4% against last year’s level, the lowest reading in March since 2020. For the month of March, the rental unit average mileage was 9.7% lower than in February 2025.
Measures of Consumer Confidence Declined in March
- The Conference Board Consumer Confidence Index declined 7.2% in March, which was worse than expected; but February’s index was revised higher. Consumers’ views of both the present and the future declined, but the views of the future declined the most, to a level that was the lowest since 2013. Consumer confidence was down 9.9% year over year. Plans to purchase a vehicle in the next six months declined modestly to the lowest level since April 2023.
- The sentiment index from the University of Michigan declined 11% in February to 57, which was lower than expected and marked a larger decline than the earlier reading at the beginning of the month. With the final monthly decline, the index is down 28% year over year, to the lowest level since November 2022. The underlying views of current conditions and future expectations declined, with expectations falling the most. Expectations for inflation in one year increased to 5% from 4.3%, and expectations for inflation in five years increased to 4.1% from 3.5%. Consumers’ views of vehicle buying conditions declined to the lowest level since November 2022 as prices deteriorated, but views of interest rates improved slightly.
- Morning Consult’s daily consumer sentiment index declined 3.9% in March, adding to the 1.7% decline in February. The index ended the month up just 0.9% year over year. According to AAA, the national average price for a gallon of unleaded gas rose to $3.20 per gallon, up 10 cents in March from the end of February, which was down 9% year over year but up 4.5% yearly.
Originally posted on Automotive Fleet