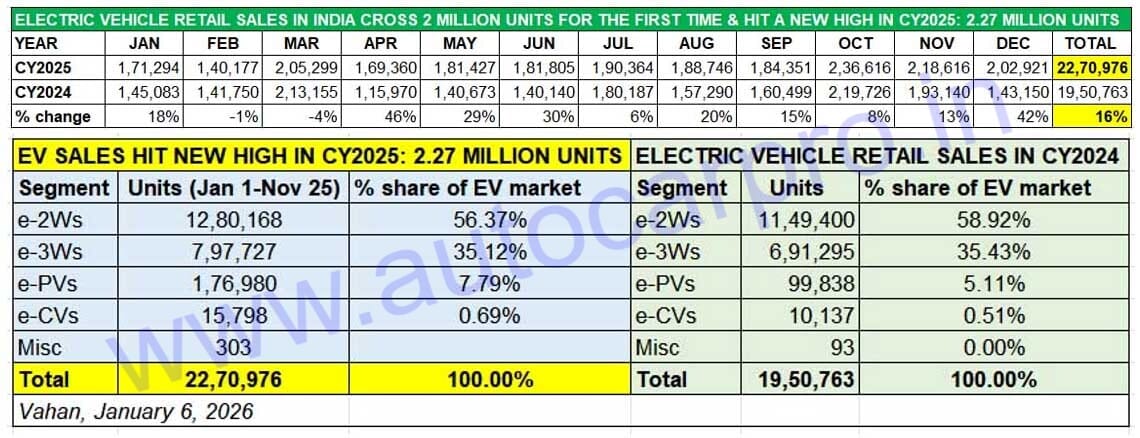
India EV Inc has entered CY2026 on a good note. Total retail sales in CY2025 were 2.27 million units, up 16% YoY (CY2024: 19,50,763 units). While this is much lower than the 27% growth achieved in CY2024, the EV penetration level in overall automobile sales in India has risen to 8% from 7.47% in CY2024 and 6.38% in CY2023.
Overall new EV deliveries in CY2025, which surpassed the 2-million mark for the first time (in November itself) should have been more but for the lesser-than-expected performance of the biggest volume segment of e-2Ws, which felt the heat of the impact of fence-sitting buyers deciding on ICE 2Ws following the slashing of taxes with the GST 2.0 reform in end-September.
Each of the four vehicle sub-segments – two- and three-wheelers, passenger and commercial vehicles –achieved their best-ever annual sales. The slower growth of e-2Ws (1.28 million units, up 11%) compared to CY2024 meant that they have a 56% share of the India EV market versus 59% in CY2024. E-3Ws (797,727 units, up 15%) accounted for a 35% share, the same as in CY2024. Meanwhile, surging demand for zero-emission passenger vehicles saw retail sales rise handsomely by 77% YoY to a record 176,980 units, giving the e-PV category an 8% share, up from the 5% it had in CY2024. And, e-CVs (15,798 units, up 57%) increased their EV industry share to 0.69% from 0.51% a year ago. Let’s take a closer look at each of the four EV vehicle categories and their top performers. 
October (236,616 units) the best-ever month yet for India EV Inc which saw 16% growth in CY2025.
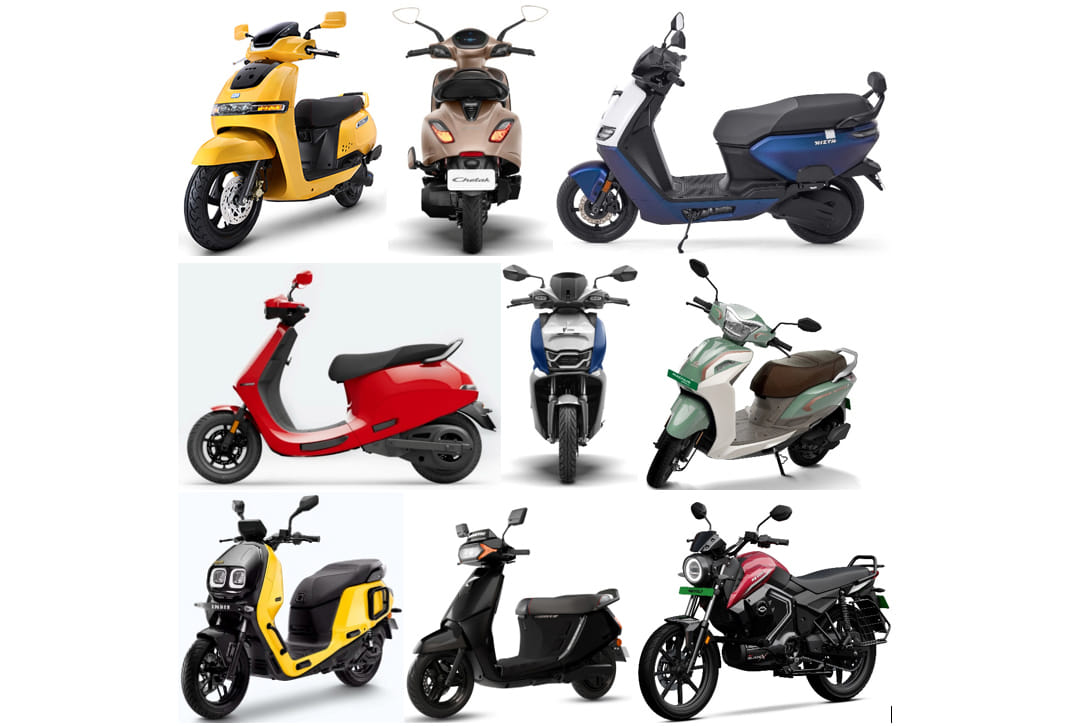
e-2W SALES
CY2025: 12,80,168 units, up 11%. EV market share: 56%
CY2024: 11,49,400 units, up 33%. EV market share: 59%
Of the total 22,70,425 EVs sold across four zero-emission vehicle sub-segments in India in CY2025 (up 16% YoY), electric scooters, motorcycles and mopeds accounted for 1.28 million units (up 11% YoY) or a 56% share. This is down from the 59% share the e-2W segment had in CY2024 when it accounted for 1.14 million of the total 1.95 million EVs across all segments.
Importantly, the 11% YoY growth has come on a high year-ago base and in the face of the reduced price differential between IC engine two-wheelers and EVs with the sharp reduction in GST. With a record 20.29 million two-wheelers sold across India in CY2025, the e-2W penetration last year was 6.30% compared to 6.07% in CY2024 (18.92 million 2Ws).
India e-2W Inc’s performance in CY2025 would have been better if it weren’t dragged down by the lacklustre performance of last year’s market leader – Ola Electric (407,700 units) – whose sales fell sharply by 51%, to less than 200,000 units.
For a comprehensive analysis of the e2W segment’s CY2025 performance and sales statistics of the Top 35 e-2W OEMs, CLICK HERE
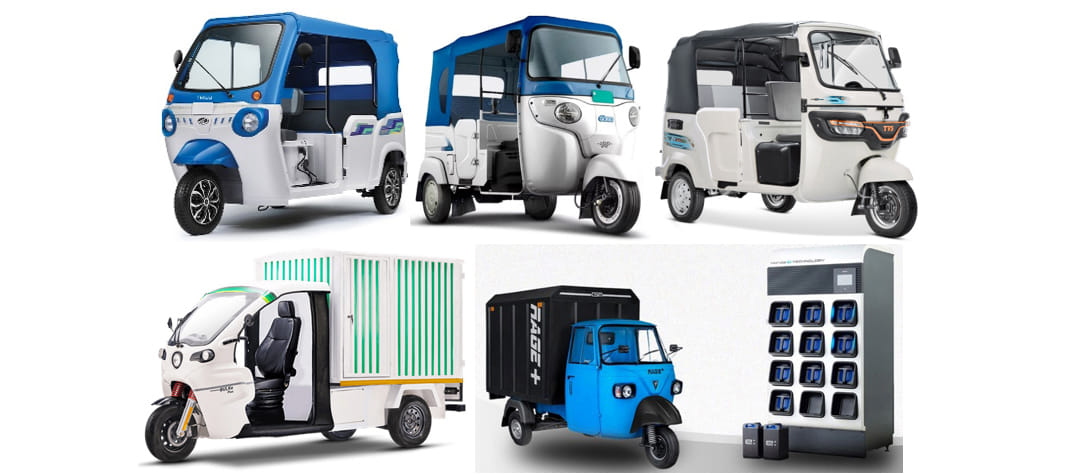
e-3W SALES
CY2025: 797,727 units, up 15%. EV market share: 35%
CY2024: 691,295 units, up 18%. EV market share: 35%
CY2025 turned out to be a repeat of CY2024 . . . a celebration of new sales heights but also a story of so near but yet so far for e-3Ws. At 797,727 units, this segment registered its best-ever annual sales with 15% YoY growth (CY2024: 691,295 units). As in CY2024, when sales fell short of the 700,000 mark by 8,705 units, CY2025 was even closer to the 800,000 milestone. . . missing it by a whisker: just 2,273 units! Nevertheless, this segment’s stellar performance has ensured that India remains the world’s largest e-3W market for the third year in a row, having beaten China in CY2023 for the first time.
As is known, the e-3W segment continues to witness the fastest transition to electric mobility, mainly driven by legacy ICE OEMs which have diversified into zero-emission vehicles. It also displays more resilience than e-2Ws and e-PVs which have been impacted by the GST reduction on ICE rivals. In fact, compared to the e-2Ws and e-PVs, which registered their highest-ever monthly sales in festive October and then saw their numbers drop in November and December, the e-3W segment registered its best monthly retails in December 2025 (88,268 units, up 49% YoY).
India e-3W Inc’s robust performance is driven by four legacy OEMs – Mahindra & Mahindra, Bajaj Auto, TVS Motor Co and Piaggio Vehicles – along with a few other players from amongst the 700-strong field. They ensured that India e-3W Inc raced past the 700,000 milestone in November itself went on to add record numbers in December.
For a deep dive into this sub-segment’s CY2025 performance and sales statistics of the Top 70 OEMs, CLICK HERE
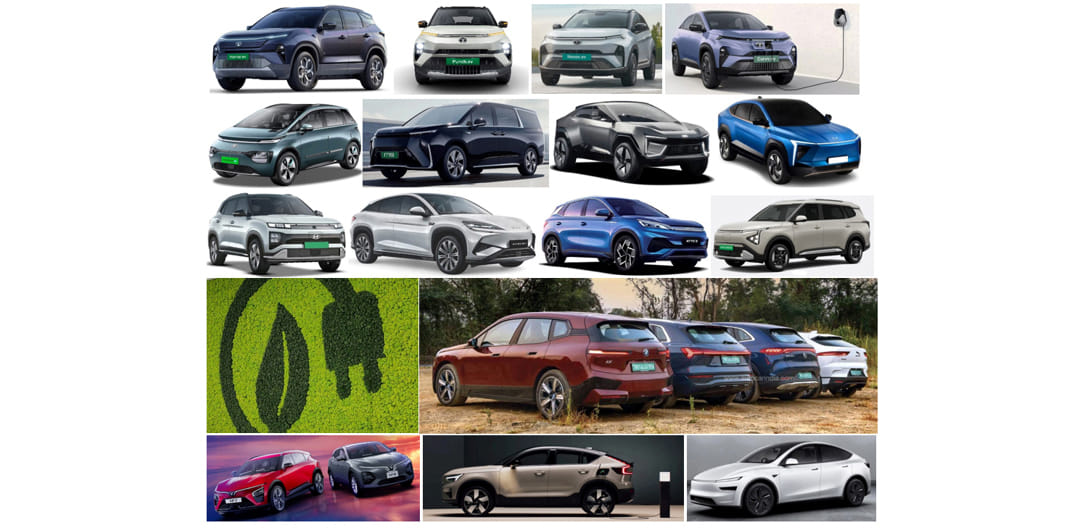
E-PASSENGER VEHICLE SALES
CY2025: 176,980 units, up 77%. EV market share: 7.79%
CY2024: 99,838 units, up 18%. EV market share: 5.11%
The Indian electric passenger vehicle segment registered its best-ever annual retails in CY2025. At 176,980 units, the YoY increase is a massive 77% (CY2024: 99,838 units). Proof of the growing demand for zero-emission cars, SUVs and MPVs in India is seen on Indian roads as PV buyers prefer to put their money on a wallet-friendly EV, despite the higher initial price compared to their petrol or diesel brethren. Between 2015 and 2024, over 425,000 electric PVs have been sold in India.
Right from January itself, CY2025 turned out to be a stellar year for India e-PV Inc. Compared to CY2024, which saw only one month of five-figure sales, CY2025 had 11 months of over 11,000-unit sales and hit a best-ever monthly high of 19,186 units in the festive month of October. The advent of GST 2.0, which reduced taxes substantially on ICE passenger vehicles and thereby increased the price differential of EVs to ICE, did impact e-PV demand in November and December. Nevertheless, that doesn’t singe the strong performance of this sub-segment of the Indian EV industry.
The robust YoY growth is reflected in the additional 77,142 e-PVs sold in CY2025 over CY2024 in a market which witnessed intense competition and has two new players in Vinfast and Tesla. Importantly, the rapid advance of JSW MG Motor India and Mahindra & Mahindra has seen market leader Tata Motors’ e-PV market share whittle down to 40% from 62% in CY2024, which is its lowest in the past four years. For a detailed look at the sales statistics of the movers and shakers of the electric car and SUV industry, CLICK HERE.
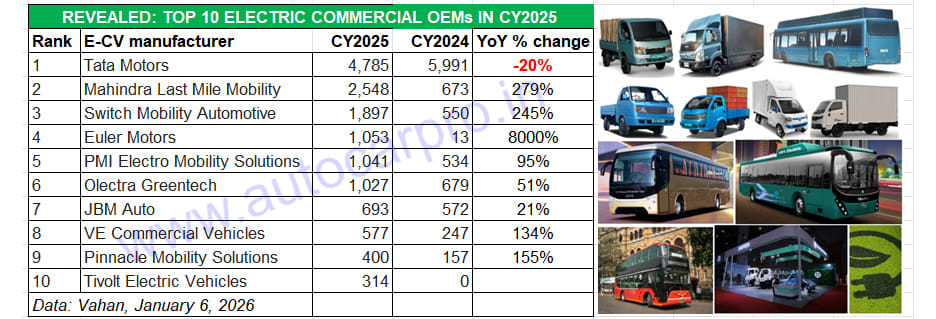
The Top 6 e-CV OEMs with 12,351 units accounted for 78% of the segment’s record sales in CY2025.
e-COMMERCIAL VEHICLE SALES
CY2025: 15,798 units, up 57%. EV market share: 0.69%
CY2024: 10,038 units, up 100%. EV market share: 0.51%
Lowest in terms of volumes but the highest in sticker price, the electric commercial vehicle segment also hit a new annual sales high. The 15,798 units sold in CY2025 are up 0.69% YoY (CY2024: 10,038 units). Interestingly, the growth is democratised across all three sub-segments (buses, light goods carriers and heavy goods carriers) as opposed to CY2024 when the heavy goods segment saw a 33% decline.
Zero-emission light goods carriers (10,759 units, up 79% YoY) accounted for the bulk of sales – 68 percent. Demand for electric buses, which are mainly bought by state transport undertakings for inter-city operations and local municipal corporations for city transport, saw sales grow by 15% YoY to 4,395 units. And heavy goods carriers, typically used for infrastructure operations, rose 152% YoY to 565 units.
Of the total 15,798 e-CVs sold in India, market leader Tata Motors accounted for 4,785 units (down 20% YoY) or a 30% share, much reduced from the 60% it commanded in CY2024. Mahindra Last Mile Mobility, with strong sales of 2,548 units (up 279% YoY) had a 16% share versus 7% in CY2024. Switch Mobility, Ashok Leyland’s EV arm sold 1,897 buses and light CVs to register 245% YoY growth and a 12% share of the e-CV industry’s sales last year. Meanwhile, Euler Motors has a robust run of the market last year – the 1,053 units give it a 7% market share in its first full year of retails. PMI Electro Mobility Solutions (1,041 units) and Olectra Greentech (1,027 units) also saw strong double-digit growth. JBM Auto (693 units), VECV (577 units), Pinnacle Mobility (400 units)) and Murugappa Group company Tivoli Electric Vehicles (314) wrap up the Top 10 e-CV listing.
EV PENETRATION RISES TO 8% from 7.47% IN CY2024 AND 6.38% IN CY2023
Following the record EV industry retails in CY2025, the EV penetration level has increased marginally albeit it could have been higher. All put together, the 22,70,976 EVs sold in CY2025 account for 8.07% of the total 28 million (2,81,19,678 units, up 7.69% YoY) vehicles sold across all segments and petrol, diesel, CNG, LPG and electric-powered vehicles in India. This is an increase over the 7.47% in CY2024 and the 6.38% in CY2023.
At 20,77,895 or 2.7 million units, the combined retail sales of electric two-wheelers (56% share) and three-wheelers (35% share) together account for an overwhelming 91% of total EV sales in India CY2025. This, however, is down from their 94% in CY2024. While electric cars and SUVs (176,980 units, account for an 8% share (up from 5$ in CY2024), the electric buses, heavy and light goods carriers segment with 14,233 units accounts for a 0.62% share (up from 0.51% in CY2024).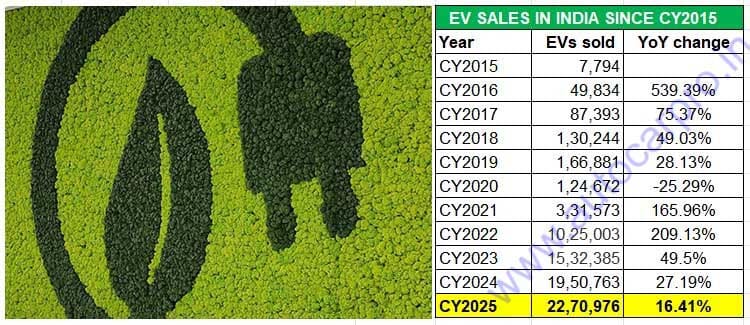
INDIA’S EV GROWTH STORY: 5.75 MILLION EVs SOLD IN THE PAST 3 YEARS
A deep dive into retail sales numbers since CY2015 reveals just how demand has grown for EVs in India, particularly in the past three years. Between 2015 to 2025, a total of 7.67 million zero-emission vehicles have been bought in the country. Of this, 5.75 million EVs or 75 percent have been delivered to customers only in the past three years, reflecting the accelerated growth in the domestic EV industry.
The government has outlined a strategic shift to e-mobility, and has targeted EVs to account for 30% of its mobility requirements by 2030. Growing consumer awareness about the need to use eco-friendly transport and the wallet-friendly nature of EV cost of ownership over the long run is proving to be a big catalyst to adoption of electric mobility. What’s more, there’s fast-paced demand coming in from the e-commerce industry and logistics players for EVs on two and three wheels, and from taxi fleet operators for electric passenger vehicles.
Meanwhile, recognising the huge business potential, auto component manufacturers are also upping the ante on localising EV parts, either through full ground-up development or through technology licences. This is leading to enhanced optimisation of production costs and in turn EV affordability, which is the overriding growth mantra.