
By: Chris Wu
Ant Financial Services Group, the parent company of Alipay, is now building with Mapbox. Their visualization team, AntV, just launched L7, an open-sourced large-scale geographic visualization framework with Mapbox maps in version 2.0.
L7 is the first open source WebGL geographic visualization engine in China. Together with Mapbox GL, L7 lets users create compelling and vivid data visualizations. L7 builds APIs that are flexible and universal, based on the semiology of graphics that control the shape, orientation, color, and texture to create designs that are easy to use and understand.
“L7 focuses on geographic data expressiveness, interaction and the design of visualization. With version 2.0, users are now able to seamlessly switch between Amap and Mapbox map depending on their development needs. Mapbox’s global maps are critical for supporting international use cases and render quickly on the L7 platform.” — Zhengxue Li, Product Manager of L7, AntV, Ant Financial, Alibaba
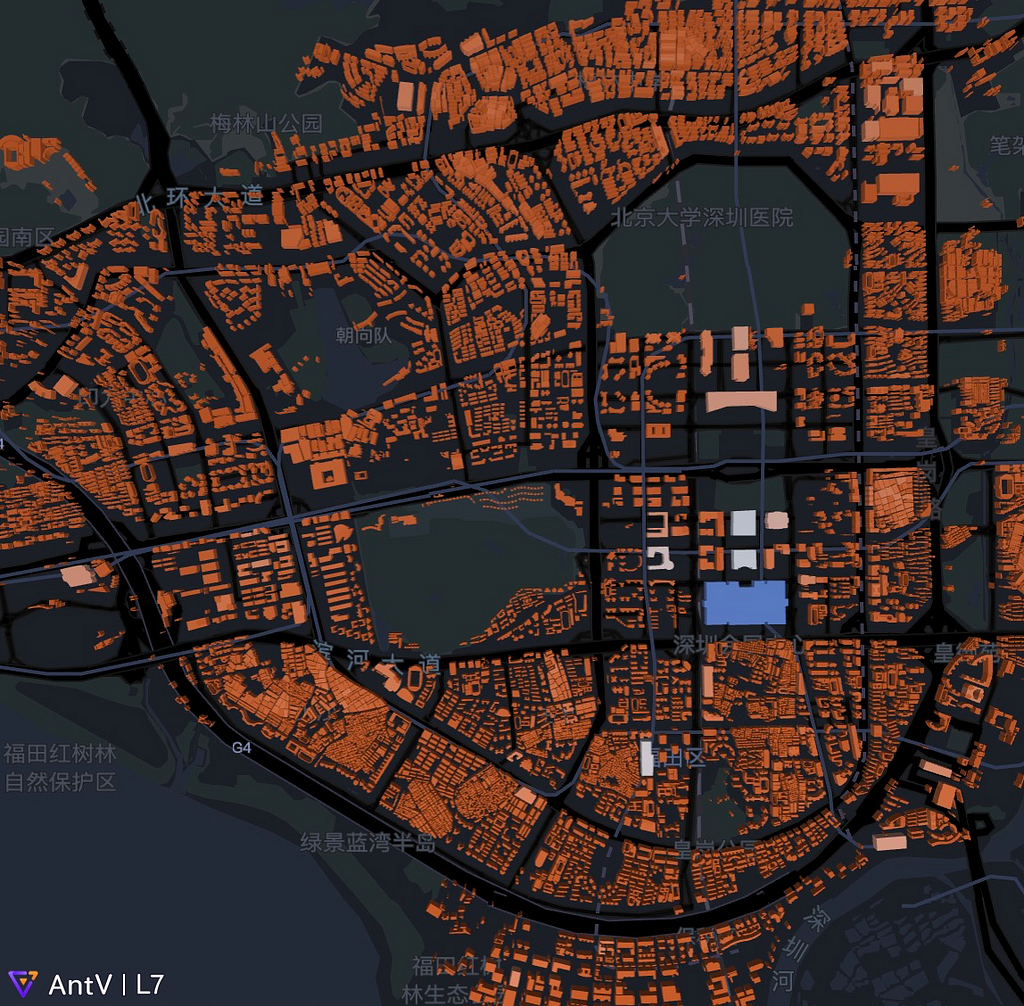
The new visualizations for L7 are stunning. Here are just a few of our favorite new features for L7 2.0:
Data-driven visualization: Visualization, graphics, and shapes designed by the data itself.

High performance rendering in 2D and 3D: Real time and dynamic rendering, even with millions of data points.
Simple and flexible data format: L7 supports a wide variety of data formats including CSV, JSON, GeoJSON for their users’ convenience.
Point layer: L7 enables point data representations through bubble chart, scatter chart, symbol map, 3D column map, aggregate map, composite chart map and custom marker — a total of 7 basic types.
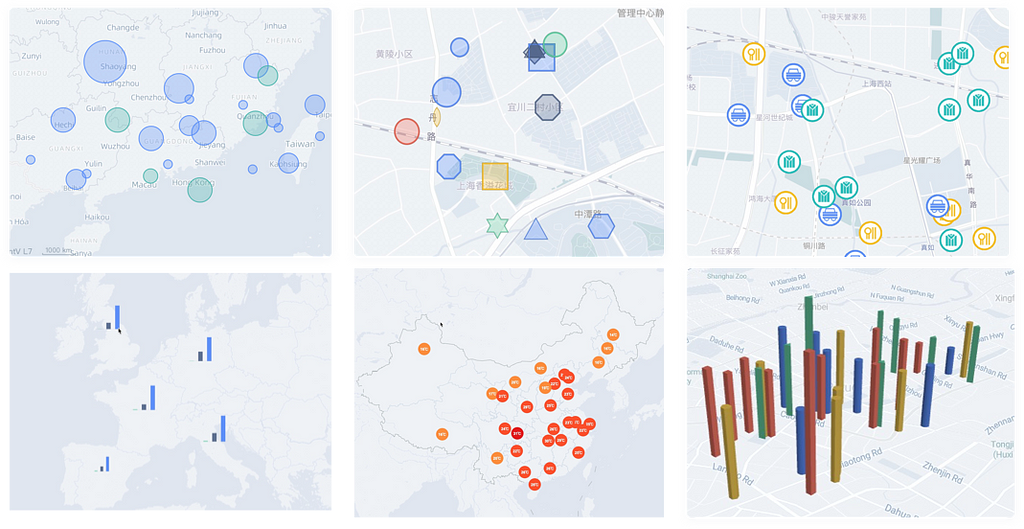
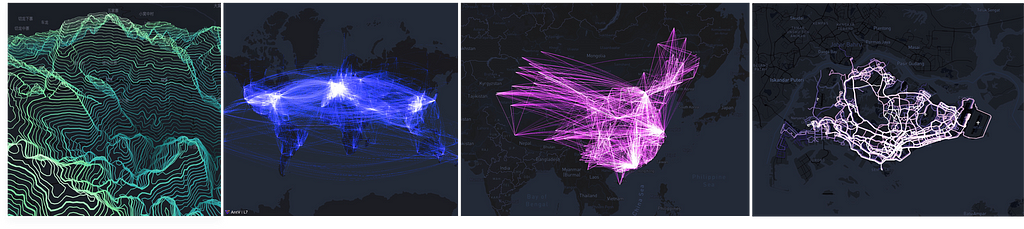
Line layer: Path trajectories, arc map (2D arc, 3D arc), and contour lines.
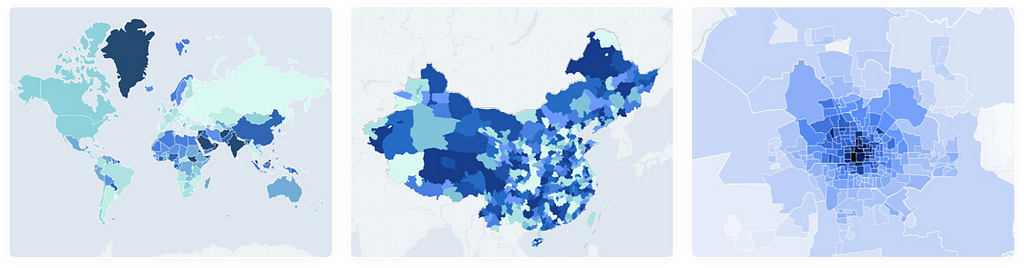
Polygon layer: Express aggregated surface distributions through grading classifications.
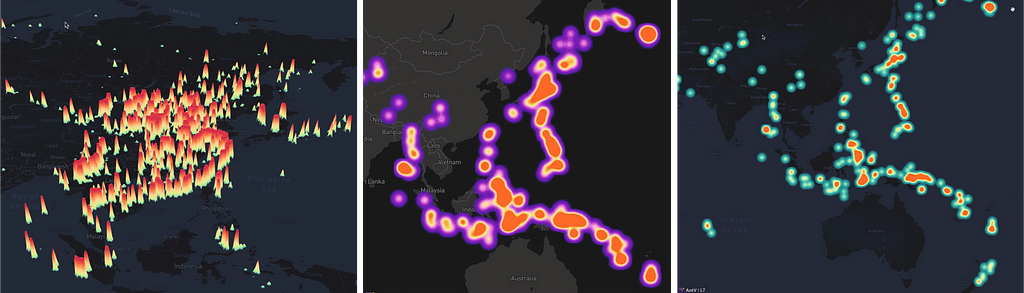
Heatmap layer: Options include a classic heatmap, honeycomb, and grid heatmap, which can support 2D and 3D display modes to meet the statistical requirements of data aggregation in different scenarios.

Start building
Build your own geographic visualization application with L7. To get started quickly, build with the demos available in the L7 Gallery, or embed the Mapbox basemaps with just a few lines of code:
const scene = new Scene({
id: 'map',
token:'****XXXX', // Key or Token for specific basemap
type: 'mapbox' // Define a basemap, it supports Mapbox and Amap
center: [103.837,1.3602],
pitch:  4.,
zoom: 10.,
rotation: 19.,
style: 'light',
});
Follow AntV’s official website and star the GitHub page to keep track of new features. Please contact Mapbox China to learn how to build powerful data visualization with big data.
Rich data visualizations for Ant Financial’s AntV L7 Platform was originally published in Points of interest on Medium, where people are continuing the conversation by highlighting and responding to this story.