New data analysis possibilities with Congressional and State Legislative districts, now in Mapbox Boundaries
By: Jeff Butler
Blue states, red counties, swing districts. Election maps rely on boundaries to quickly synthesize and translate complex election data. Whether counting vote totals or analyzing electoral shifts, interpreting the data relies on aggregating it by geographic areas.
2020 will be a big year for election maps so we’re offering new resources and boundary data to help developers map.
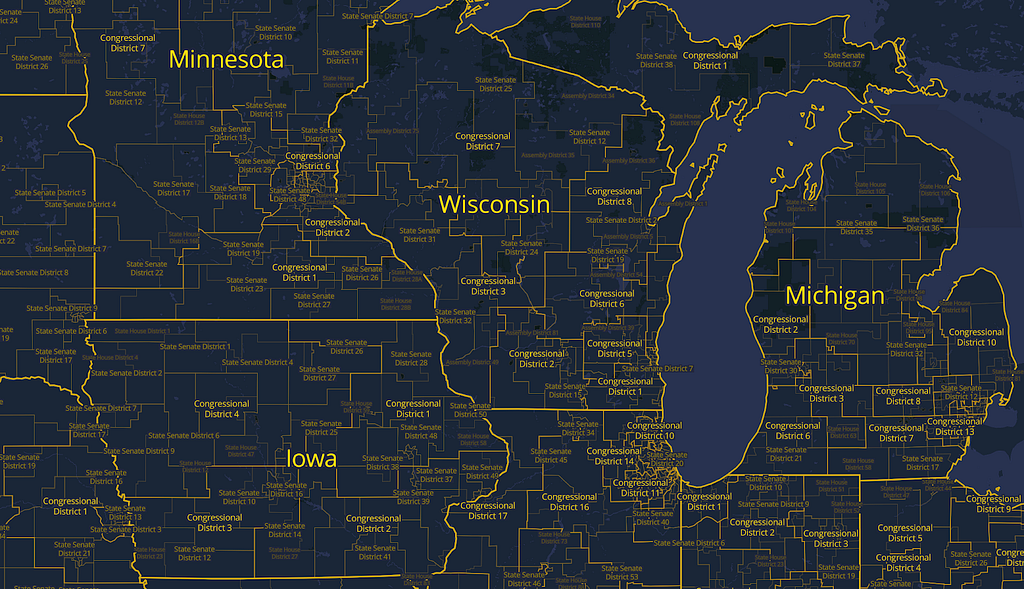
Today, Mapbox Boundaries added a new collection of legislative boundaries that include four different levels of US electoral boundaries including Congressional districts, State Senate, and State Representative. This follows our launch yesterday of Mapbox Elections that includes a tileset of historical election returns and demographic data powered by the State and County levels of our administrative boundaries, now available for everyone Studio.
Why boundaries are essential in election analysis
Let’s look at one of the most well-known election maps from Robert J. Vanderbei, a professor at Princeton, who introduced a map after the 2000 election called ‘Purple America’.
The ‘Purple America’ choropleth time series and the 3D extrusion of voter density are only possible because those maps are built from boundary polygons. These polygons properly outline each US County and allow data points to be joined to those areas based on their geographical properties. In short, these maps would not be possible without boundaries.
The New York Times’ “An Extremely Detailed Map of the 2016 Presidential Election” provided an incredibly granular look of America’s partisan landscape by visualizing results bucketed into approximately 3,100 counties and 168,000 voting precincts — more than 170,000 different boundaries.
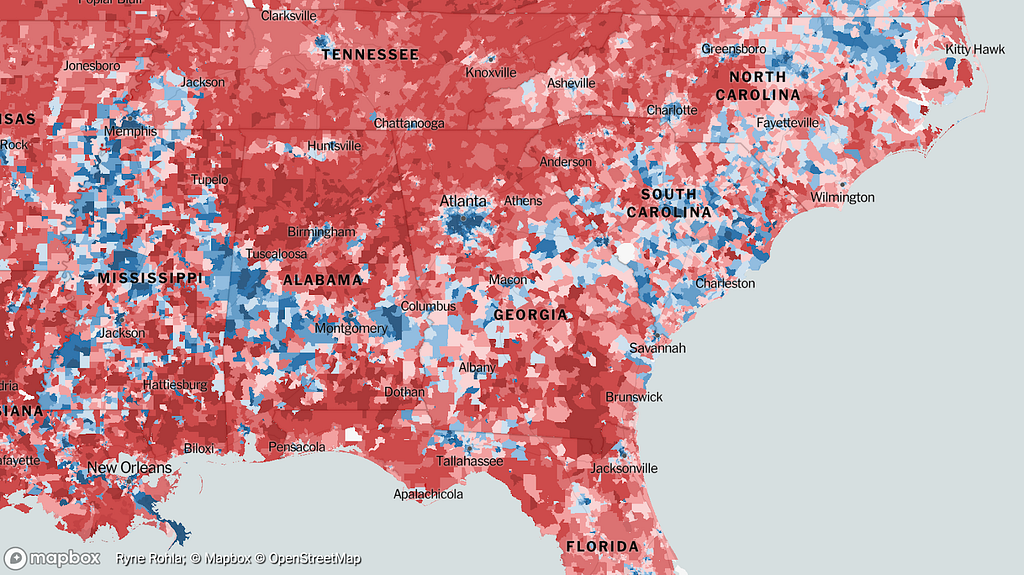
Sourcing, maintaining, and edge matching all these boundaries is a ton of work. Mapbox Boundaries takes care of that work, so developers can not only contextualize electoral results within a district or county, but also cross-reference those results or any other data element with multiple other boundaries types.
Using Boundaries
The updated coverage of legislative boundaries opens up many possibilities for electoral analysis and breaking down election coverage in more detail.
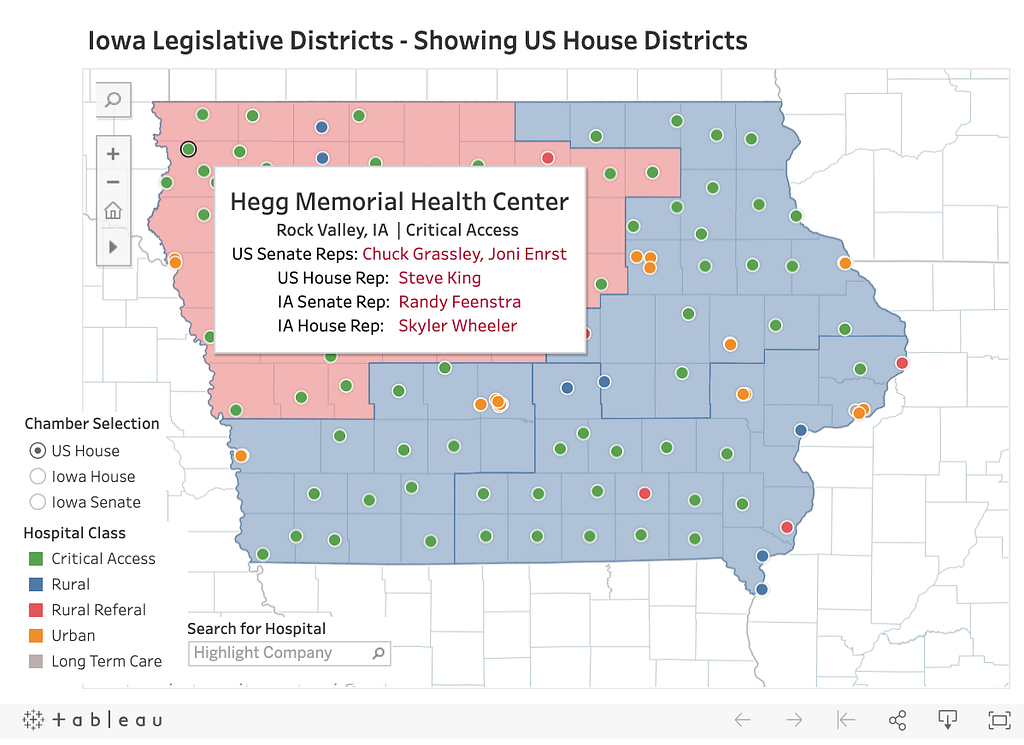
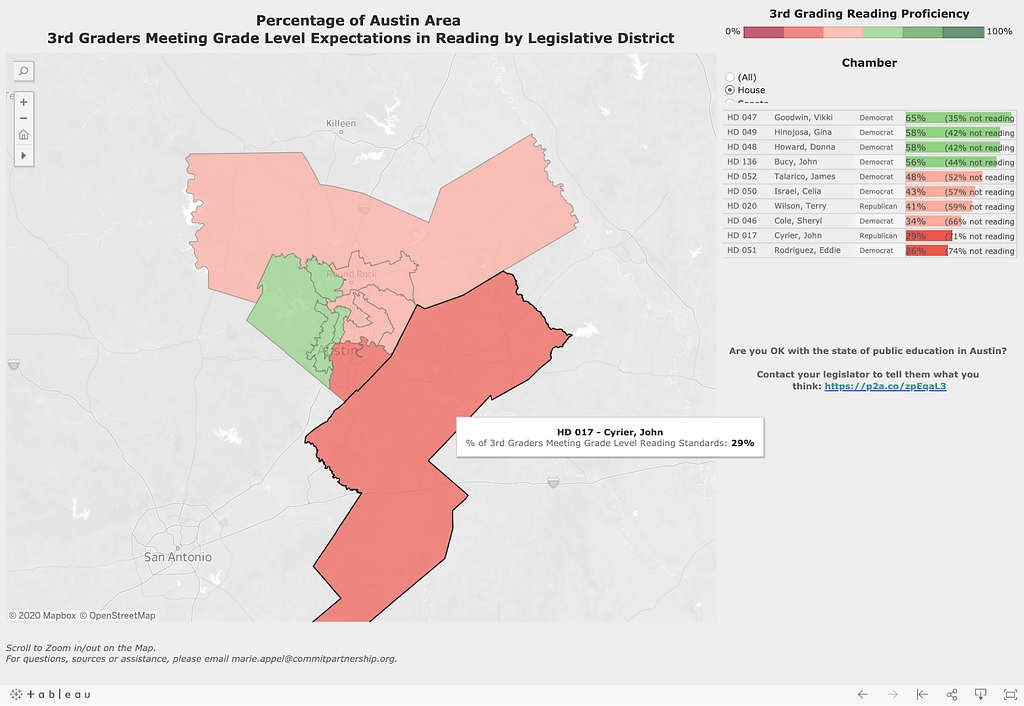
Media companies can use legislative boundaries to do live reporting of election results for local districts. Policy experts can analyze the impact of changes in representation and funding tied to political shifts in legislative areas. Retailers and advertisers could use legislative boundaries at various levels to better understand territories’ political leanings, and how their brand may be perceived. Healthcare organizations can compare health outcomes between administrative boundaries and legislative districts to better analyze trends.
Explore boundaries for electoral maps
If you’ve never built with Boundaries, get started building election maps now with the state and county election tilesets now available to all users. Visualize trends in party support and turnout throughout the years, and how they correlate with population changes — or any additional custom data you want to analyze. Read more about the data and how to access it here.
Our full updated boundary coverage is visible in the interactive coverage map. To learn more read our documentation, and when you’re ready to get started reach out to our team to request a demo.
Jeff Butler – Senior Product Manager – Location Intelligence – Mapbox | LinkedIn
Maps feature data from Mapbox and OpenStreetMap and their data partners.
Using Boundaries for election analysis was originally published in Points of interest on Medium, where people are continuing the conversation by highlighting and responding to this story.