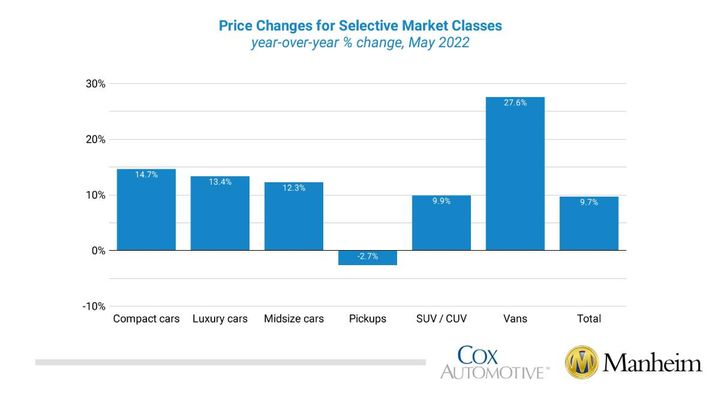
Mirroring April’s figures, vans again had the largest year-over-year gains, followed by compact and sports cars, while pickups declined compared to the overall market.
Source: Cox/Manheim
Wholesale used-vehicle prices (on a mix-, mileage-, and seasonally adjusted basis) increased 0.7% in May from April, according to the Manheim Used Vehicle Value Index released June 7. The index rose to 222.7, up 9.7% from a year ago. The non-adjusted price change in May increased 1.1% compared to April, leaving the unadjusted average price up 12.1% year over year.
In May, Manheim Market Report (MMR) values saw a shift in price trends, with prices increasing in the first three weeks but declining over the last two. During the previous five weeks, the Three-Year-Old Index increased a net 0.4%. In May, daily MMR Retention, which is the average difference in price relative to current MMR, averaged 98.7%, meaning market prices were slightly behind MMR values.
The average daily sales conversion rate declined to 55.7%, which was a typical seasonal pattern but was at a level below normal for the time of year. For example, the sales conversion rate averaged 57% in May 2019. The lower conversion rate indicates the month saw buyers with more bargaining power for this time of year.
All major market segments saw seasonally adjusted prices that were higher year over year in May, except for pickups. Mirroring April’s figures, vans again had the largest year-over-year gains, followed by compact and sports cars, while pickups declined compared to the overall market. Most of the major segments saw seasonally adjusted price increases on a month-over-month basis, with vans improving the most. The seasonal adjustment drove most of the increases. Six of the eight major market segments saw price gains from April, with full-size and luxury cars declining.
Compared to last year, retail used sales pace improved in May. Leveraging a same-store set of dealerships selected to represent the country from Dealertrack, Manheim estimates that used retail sales declined 1% in May from April as the typical seasonal trend sees declines in May as tax refund season ends. The Dealertrack estimates indicate used retail sales were down 7% year over year, which was the best year-over-year performance so far this year. The issuance of tax refunds continues to be behind normal, as issuance in May continued. Through May 20, 74% of projected refunds for the year had been issued, when in 2019 essentially all refunds had been issued by early May. The average refund is at a new record and up 7% year over year.
Using estimates of used retail days’ supply based on vAuto data, May ended at 44 days of supply, which was down from 49 days at the end of April but higher than how May ended in 2021 at 37 days. Leveraging Manheim sales and inventory data, wholesale supply is estimated to have ended May at 24 days, which is higher than how May 2021 ended at 19 days but lower than how April ended at 25 days.
May total new-light-vehicle sales were down 30% year over year, with two fewer selling days compared to May 2021. By volume, May new-vehicle sales were down 11% from April. The May SAAR came in at 12.7 million, a 25% decline from last year’s 16.9 million and down 13% from April’s 14.5 million pace.
Combined sales into large rental, commercial, and government fleets were down nearly 20% year over year in May: Sales into rental were down 33% year over year, while sales into commercial fleets were flat and sales into government fleets were up 6%. Including an estimate for fleet deliveries into dealer and manufacturer channels, the remaining retail sales were estimated to be down 31% in May, leading to an estimated retail seasonally adjusted annual rate (SAAR) of 10.9 million, which is down nearly 27% from last May’s 14.8 million pace and down 13% from last month’s 12.5 million level. Due to weakness in retail sales, the fleet share rose in May to 13.9% of all vehicle sales, up from 12.2% last May and up from 13.5% last month.
Rental risk mileage down and still stable from last year: The average price for rental risk units sold at auction in May was up 32% year over year. Rental risk prices were up 3.8% compared to April. Average mileage for rental risk units in May (at 63,500 miles) was down 28% compared to a year ago and down 1.3% from April.
Measures of consumer sentiment decline again in May: Consumer Confidence declined 2% in May, according to the Conference Board. The decline left confidence down 11.3% year over year. The underlying measures of both the present situation and future expectations declined. Plans to purchase a vehicle in the next six months declined but were slightly higher than a year ago. Plans to purchase a home also declined and were higher year over year. The sentiment index from the University of Michigan declined 10.4% in May as both current conditions and expectations declined. The Michigan reading was down slightly from midmonth and was at the lowest full-month reading since August 2011. Buying conditions for vehicles declined and were only slightly better than the all-time low recorded in February. The Morning Consult index daily index also declined in May, as it was down 4.4% for the month. The daily index from Morning Consult was at its lowest level so far for the pandemic on May 30, as inflation, declining equity markets, and increasing cases of COVID driven by omicron variants weighed on consumer attitudes.
Originally posted on Vehicle Remarketing
