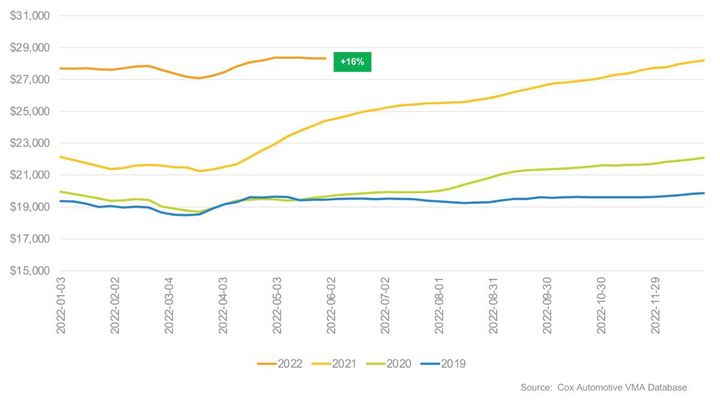
The average listing prices have been edging down since May 9. Further declines should continue over the summer.
Source: Cox Automotive
In contrast to new vehicles that are seeing rising prices, the average listing price of used vehicles has begun to inch down ever so slightly as supply holds relatively steady, according to the Cox Automotive analysis of vAuto Available Inventory data released June 16.
“The end of May showed interesting and divergent patterns for new and used listing prices,” said Charlie Chesbrough, Cox Automotive senior economist, in a news release. “We have been expecting vehicle inflation to ease as the anniversary of the start of the chip shortage passes, and that, indeed, is occurring in the used market.”
The average listing price as May closed dipped to $28,312, compared with a revised $28,372 at the end of April. The average listing prices have been edging down since May 9. Price growth versus the year earlier was 28% in mid-April but has been falling every week since then and now stands at 16%. Chesbrough predicts further declines should continue over the summer.
Meanwhile, inventory is holding relatively steady. At the end of May, the total supply of unsold used vehicles on dealer lots across the U.S. stood at 2.47 million units. That compared with Cox Automotive’s revised number of 2.52 million at the end of April. Inventory opened the month of June at 7% above year-ago levels.
Days’ supply at the end of May held at 42. Days’ supply in May was 24% above year-ago levels. The Cox Automotive days’ supply is based on the daily sales rate for the most recent 30-day period, in this case, ended May 30.
As is traditionally the case, used-vehicle supply had been building in the early part of the year until mid-February, the kick-off of the tax refund season when consumers often use that money to buy used vehicles. Although it remained ahead of the year-ago level, the supply began edging downward as spring approached and sales picked up.
However, tax refund issuance has been behind all year. The latest IRS data showed the slow pace of tax refunds affected consumer spending, including on used cars. Through May 20, 74% of projected refunds for the year had been issued, when in 2019 100% had been by two weeks earlier. However, the average refund is up 11% compared with 2019 and up 7% from a year ago, the highest refund ever recorded at this stage of tax refund season. Much of that spending may occur, instead, in the second quarter.
By price category, the lower the price, the lower the days’ supply. Under $10,000 had a 25 days’ supply. From $10,000 and up, each category had a progressively higher days’ supply ranging from 31 to 49.
Originally posted on Vehicle Remarketing
