

Coauthored with Marco Laumanns
On-demand mobility services have proliferated in recent years. If properly designed, they can be instrumental in revolutionizing public transportation by allowing the movement of more people while also reducing the fleet size and the distance driven. Bestmile’s white paper and technical report on service design offer a detailed description of the science around designing, simulating and evaluating the performance of such services, using the city of Chicago as a test case. While the design process is complex, one essential ingredient stands out: ridesharing.
A shared service is one which allows for passengers with independent bookings to share the same vehicle for at least part of their ride. Ridesharing helps achieve a much higher utilization of the available fleet by boosting the average vehicle occupancy, which translates into more transportation work per kilometer driven. An important byproduct is a substantial reduction of deadheading as well. In our Chicago case study, we observe that a shared service can be up to four times more effective in moving people per kilometer driven than its non-shared counterpart. The efficiency gains are even more striking when we compare a shared service to the currently operating taxi service in Chicago. We can cut the number of required vehicles by a factor of seven and the distance driven by at least 40%, while still maintaining an acceptance rate close to 100%. Similar conclusions are reported in the state of the art.
Yet, these improvements are not for free. Better fleet efficiency comes at the expense of some deterioration in passenger convenience. By definition, a shared service may entail excess ride time for some or all of the passengers. This is the extra time in excess of the direct ride time that a passenger spends in the vehicle due to detours for picking up or dropping off other passengers. Clearly, there is a trade-off between fleet efficiency and passenger convenience. But how can we quantify it? And how can we use it to recommend an optimal service design?
Quantifying the trade-off
To illustrate this, we introduce the fundamental ridesharing diagram, which plots the average excess ride time against the average distance driven per ride, key performance indicators measuring passenger convenience and fleet efficiency, respectively. The figure below describes a service with 480 vehicles covering the city of Chicago. Each point represents the performance of the service along the two dimensions for a given value of the maximum excess ride time. The maximum excess ride time is a hard service level constraint guaranteeing that no passenger will experience an excess ride time longer than the prescribed value. Tightening the maximum excess ride time reduces the ridesharing potential. This results in a lower average excess ride time and, inevitably, an increased average distance driven per ride. Relaxing the maximum excess ride time has the opposite effect. As more rides are shared, the average excess ride time grows for the benefit of a shorter average distance driven per ride.
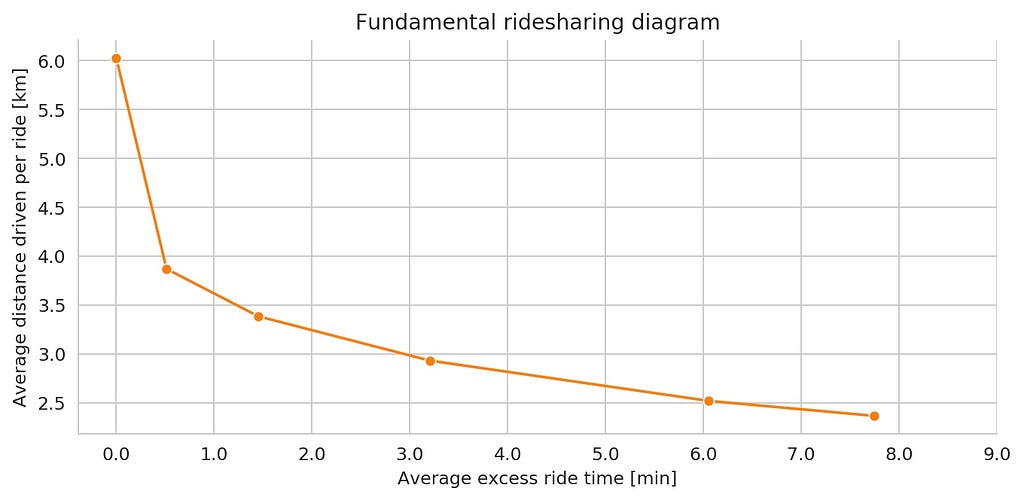
The fundamental ridesharing diagram is a Pareto frontier. That is, an improvement in one dimension along the curve always entails a deterioration in the other, while all points above the curve are suboptimal. The shape of the Pareto frontier illustrates some important features of ridesharing services. First and foremost, we can achieve a significant gain in fleet efficiency compared to a non-shared service by accepting just a small deterioration in passenger convenience. See the point in the upper left corner of the plot? It represents the performance of a service with no ridesharing. By enabling ridesharing, we cut the average distance driven by approximately 30% while still keeping the average excess ride time under a minute. This is reflected in the initial sharp drop of the curve and sends a strong message to operators. In particular, it signals an opportunity for substantial cost reduction with virtually no perceived deterioration of service quality. As the maximum excess ride time constraint is relaxed further, the efficiency gains taper off. In other words, it becomes increasingly more difficult to improve efficiency without significantly deteriorating passenger convenience.
Finding a socially optimal service design
Having derived a fundamental ridesharing diagram of our service area, what service design should we choose? What should be the target for the distance driven and what is an acceptable value for the excess ride time? These questions depend on the business goals of each individual operator, yet the fundamental ridesharing diagram can help identify a socially optimal service design. For all practical purposes, passengers want to avoid excess ride time while operators want to minimize the distance driven. The value of travel time can be used to compute the cost of excess ride time as perceived by passengers. Similarly, the vehicle operating cost can be used to obtain the cost of distance driven as experienced by the operator.
As a Swiss company, we are aware of the extensive research on transportation carried out in Switzerland. Here, the value of travel time when commuting by public transport is the equivalent of $27.81 per hour, or $0.46 per minute. In addition, the vehicle operating cost for a minivan similar to the ones we simulated in Chicago is the equivalent of $3.54 per kilometer. Assuming similar economic characteristics and for the sake of illustration, let’s use the same values for our Chicago case study. Thus, each kilometer of distance savings for the operator is worth 3.54 / 0.46 = 7.70 minutes of excess ride time for the passengers. From the operator’s standpoint, $3.54 is the marginal cost per kilometer of providing 7.70 minutes of time savings for a passenger. For the passengers, $0.46 is the marginal willingness to pay for a minute of excess ride time savings.
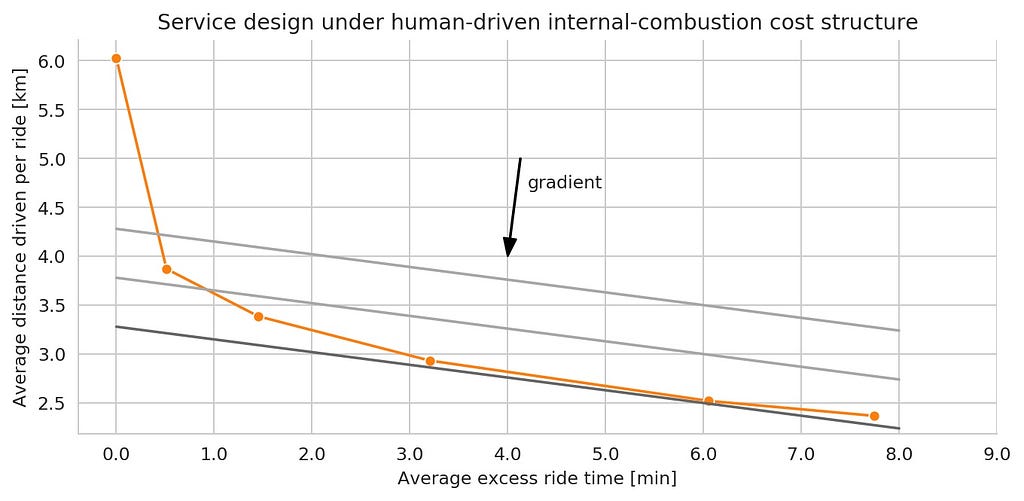
In the next figure, we present three sets of socially optimal services superimposed on the fundamental ridesharing diagram. Each set is represented by a line comprising all services with the same social cost. In a society consisting of an operator and passengers, moving from left to right along a line results in the same social cost being increasingly borne by the passengers. The gradient indicates the direction of lower social cost services. As we said before, all points above the Pareto frontier are suboptimal because we can improve both the distance driven per ride and the average excess ride time without deteriorating the other. From the points on the Pareto frontier, we seek the one with the lowest social cost. This is the point with approximately 2.5 kilometers of distance driven per ride and six minutes of excess ride time. That is, given the current cost values, the socially optimal service is one with a relatively high average excess ride time.
Exploring different scenarios
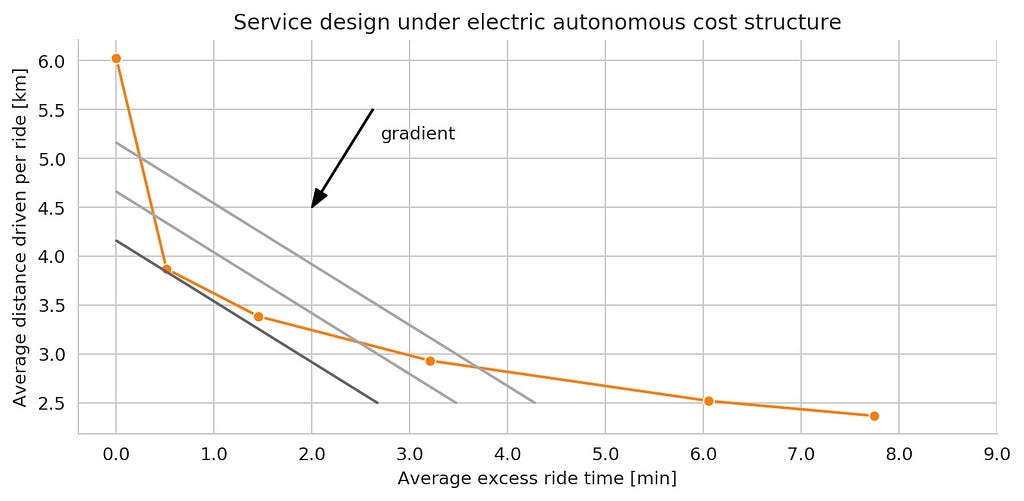
The fundamental ridesharing diagram can also be used to conduct sensitivity analysis with respect to the current cost structure. Consider a scenario in which the vehicle operating cost is significantly reduced. An electric autonomous minivan would have an operating cost of merely $0.74 per kilometer — a configuration depicted in the last figure. In this case, the socially optimal service design results in significantly less excess ride time. Scenarios where the society becomes more affluent, and values travel time more, lead to similar conclusions. Though stylized, this type of analysis can be used to make well-informed service design recommendations. Obviously, one must be aware of the underlying assumptions. Here, we assume that passenger convenience only depends on the excess ride time. In addition, we overlook the fact that services with less ridesharing, and thus shorter excess ride times, are associated with more congestion, which itself impacts travel times negatively.
Towards a mobility of the future
So what are the main takeaways here? To begin with, ridesharing will be an essential ingredient to designing viable solutions for the transportation problems of our growing cities. Replacing privately owned cars with non-shared services, no matter how smart, will only make things worse due to deadheading. Failures to address such questions are beginning to emerge as cities like New York and San Francisco suffer from increased congestion due to the thousands of additional vehicles on city streets.
The fundamental ridesharing diagram shows that fleet efficiency can be improved by 30% with only half a minute of average excess ride time. And it can be doubled with only three minutes of excess ride time, even in a big city like Chicago. Ridesharing is crucial but leveraging its full benefits requires state-of-the-art matching and routing algorithms. The results presented above are produced using the algorithms in Bestmile’s Fleet Orchestration Platform. As a consequence, the fleet behavior is realistic and the obtained insights and conclusions are representative of real deployments.
The fundamental ridesharing diagram was originally published in Bestmile on Medium, where people are continuing the conversation by highlighting and responding to this story.