By: Lo Bénichou
This is part one of a guide series on US electoral maps and data visualization. Make sure to look out part two (coming soon), on using the Feature State API and Albers USA to join your data on the fly.
We recently released an Albers USA map style featuring all 50 US States, Puerto Rico, and their counties that anyone can add to their account. Albers USA is a popular projection for US-centric visualizations because it shows a scaled-down Alaska and Hawaii close to the rest of the states.
Following the tips from Armand Emamdjomeh in “Washington Post’s electoral maps: how we built it” and Josh Katz in “How the NYT mapped every dollar,” we created this style using tools like Matt Bloch’s Mapshaper and Development Seed’s Dirty Reprojector.
The steps described in this guide can be repeated for any projections, but this technique has limitations. The Albers USA style, for instance, is a representation of Albers USA in a web Mercator projection. Meaning that to add any additional geometries, like points or polygons, you will need to reproject that data using Dirty Reprojector for the data to display “correctly” over the United States.
Dealing with the data
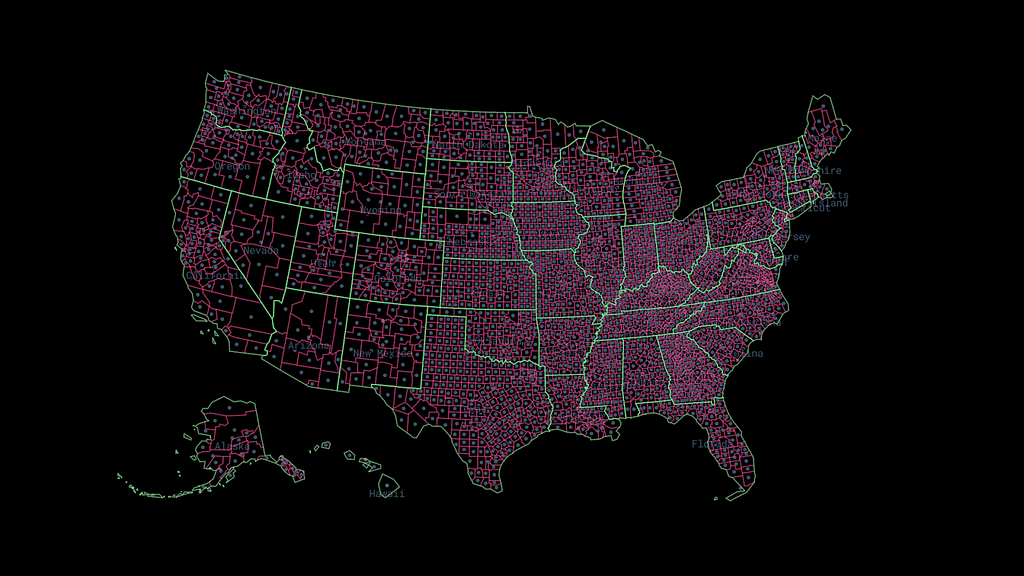
To start, download the cartographic boundary shapefiles from the US Census. You can download both county and state, depending on your needs. I suggest downloading cb_2018_us_county_500k.zip and cb_2018_us_state_500k.zip .
Data cleanup
Once you download the files, head to mapshaper.com to filter and clean up the data. Parts of this process are completely optional, like renaming or filtering fields. However, filtering geometries is not optional. If you don’t filter territories like Guam, you will end up with null geometries after reprojecting, which can pose an issue when converting a GeoJSON to MBTiles.
Mapshaper is a command line tool that allows you to manipulate and edit geographic files. For our use case, we’re going to use Mapshaper for three main tasks:
- Filter out unwanted features like Guam and other US territories that aren’t displayed in the Albers USA projection
- Edit and drop some properties like “AWATER” or “ALAND” to lighten up the file size and perform data join later on
- Join counties and states for consistent topology when we simplify and tile the data to upload it to Mapbox
Edit and filter fields
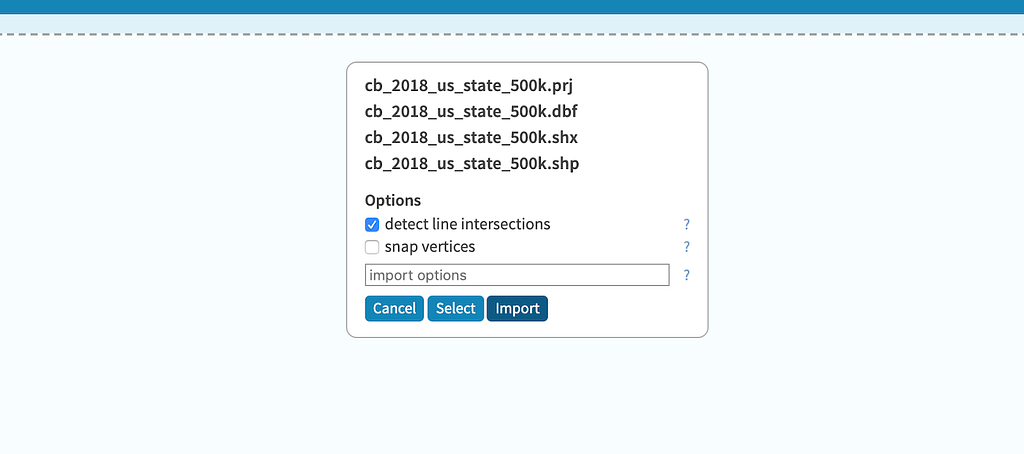
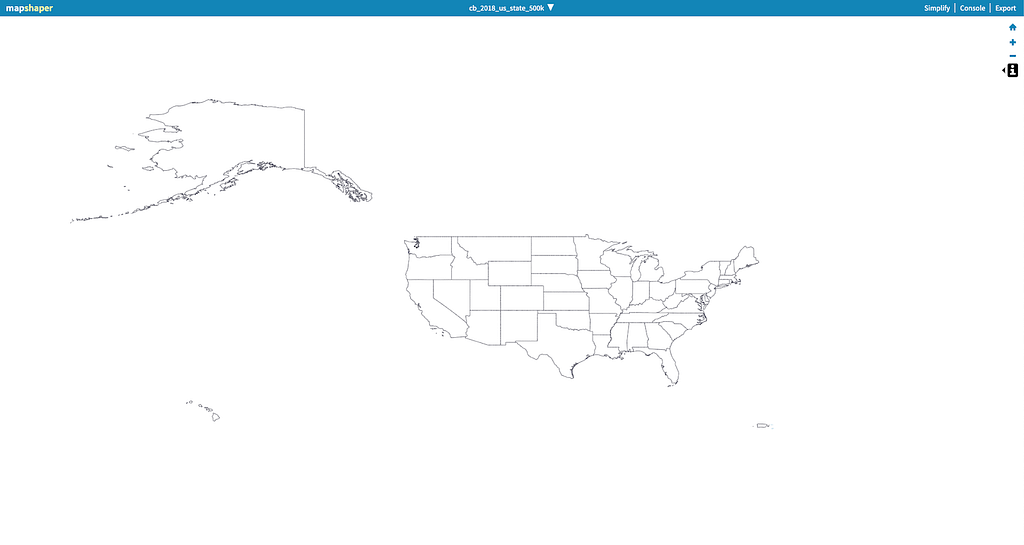
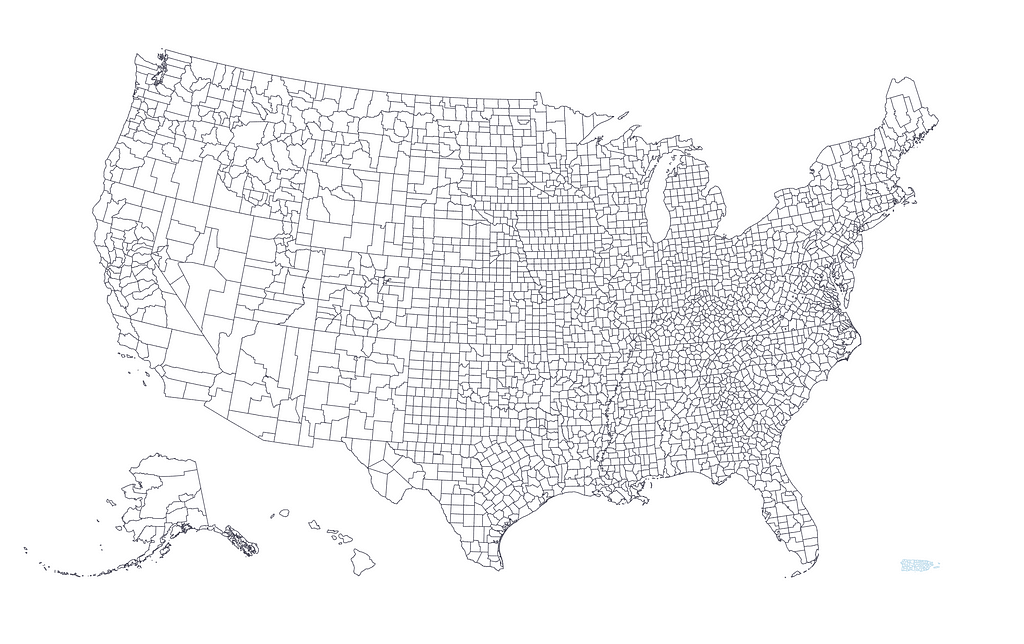
Next, open Mapshaper and upload the state shapefiles. Mapshaper will show you which files are being imported. Once you review the files, select “Import”.
You should see the United States like so:
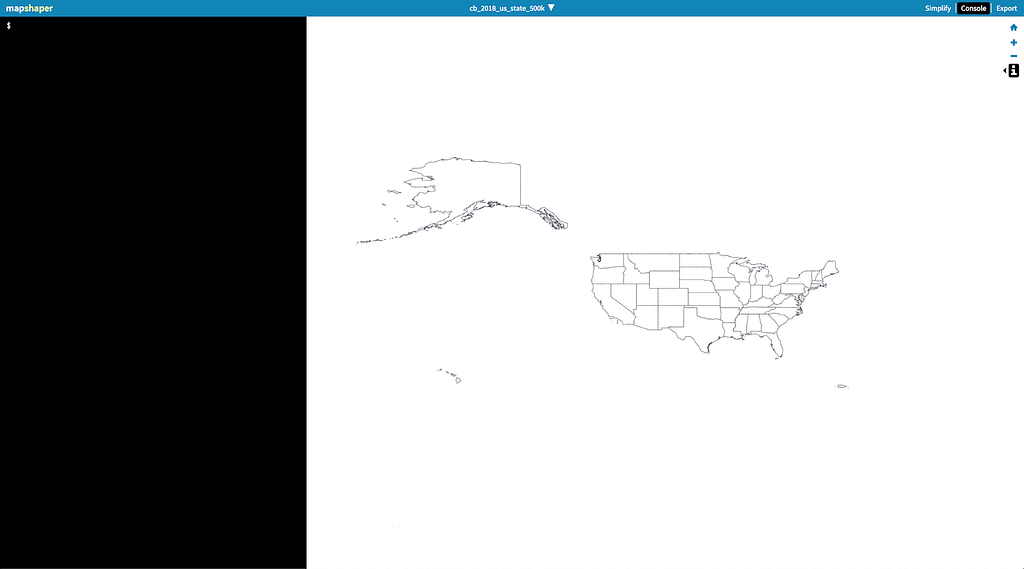
With the file uploaded, we can manipulate it using the console. In the upper right corner, click on “console” to open the left panel so we can enter some commands.
The first thing I did was rename some of the fields and drop extraneous fields. If you click on the “i” icon on the right and hover on the map, you will be able to see the properties (fields) for each feature.
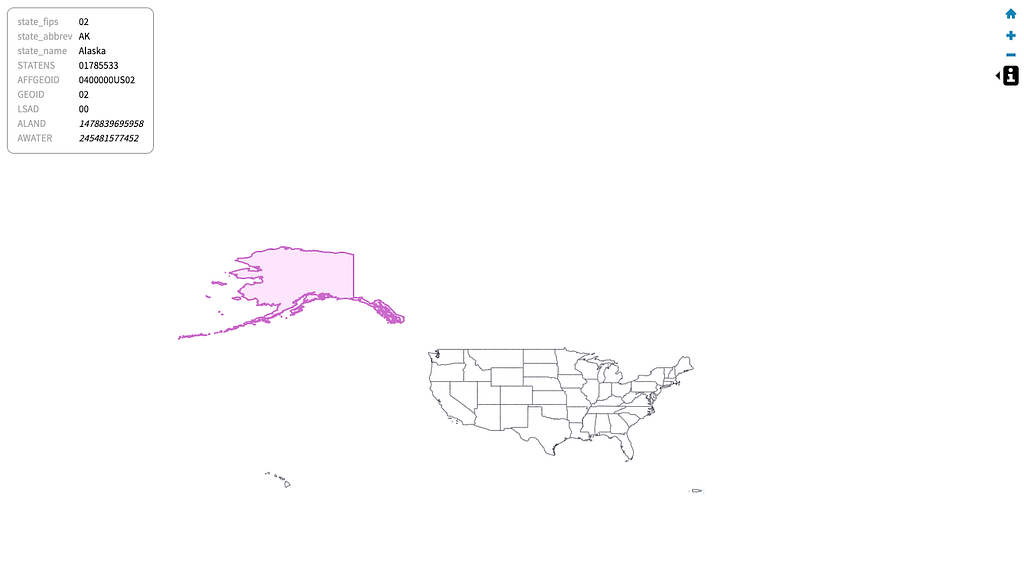
To rename the fields, enter the following command:
rename-fields fields='state_fips=STATEFP,state_abbrev=STUSPS,state_name=NAME'
Then filter out all the other fields using:
filter-fields state_fips,state_abbrev,state_name
Deciding which properties to keep is entirely up to you. If you’ve uploaded shapefiles with demographic data, then you may want to keep those relevant properties to visualize it later on. However, to join data to the geometry in Mapbox GL JS, it is good to retain at least one unique property — in this case, the state’s and the county’s FIPS code.
Additionally, since I plan on joining states and counties into one GeoJSON file, I need to differentiate the state and county features, so I added a property called “type” and assigned it the value of “state” using the `each` command:
each 'type="state"
Filtering out territories
Now let’s remove some features using the filter command. We need to take out Guam, the US Virgin Islands, the Commonwealth of the Northern Mariana Islands, American Samoa, and Puerto Rico:
filter 'state_fips != 69'
filter 'state_fips != 66'
filter 'state_fips != 78'
filter 'state_fips != 60'
filter 'state_fips != 72’'
You should have 51 features left (50 states + DC). I’ve intentionally left out Puerto Rico because the process to include it is a bit more complex as we will see during the reprojection step.
You can repeat the same steps for the counties Shapefiles in the same window by dragging and uploading the file. Note that if you plan on only using the state layer for a visualization, you do not need to repeat the process with the county layer though we will be using counties in part two of this series (link coming soon).
Once you’re finished, join the state and county layers using the following command:
merge-layers force target={NAME OF LAYER 1}, {NAME OF LAYER 2}
We’re now able to export one GeoJSON file with both state and county shapes, and reproject it using Dirty Reprojector.
Reprojecting
This part of the tutorial is straightforward if you only care about traditional projections (i.e. Albers USA without Puerto Rico).
Dirty Reprojector uses d3.geo and offers a wide number of projections, including Albers USA. However, Albers USA does not include Puerto Rico by default. To add PR, I had to modify the code slightly using this code from Mike Bostock. For the sake of simplicity, let’s stick to the default capabilities of Dirty Reprojector.
First, install Dirty Reprojector using npm. Once it’s installed, use the following command to project your GeoJSON into Albers USA and project it back to Mercator while preserving the Albers USA projection:
cat YOURFILENAME.json | dirty-reproject --forward albersUsa > albersusa.geojson
Upload and style in Studio
To upload the GeoJSON file to Mapbox, drag it and drop it directly into the tileset dashboard, or tile it using Tippecanoe if the file is too large or the geometries need simplification. Here is the command I used to convert my Albers USA GeoJSON to MBTIles:
tippecanoe -o albersusa.mbtiles -n "US states and counties from the US Census filtered to 50 states + Puerto Rico" --named-layer=albersusa:albersusa.geojson -zg --drop-densest-as-needed --extend-zooms-if-still-dropping --simplification=3 -ab -ai
This command takes a file named “albersusa.geojson,” simplifies it, adds unique ids, detects shared borders, and determines the proper zoom level for resolution.
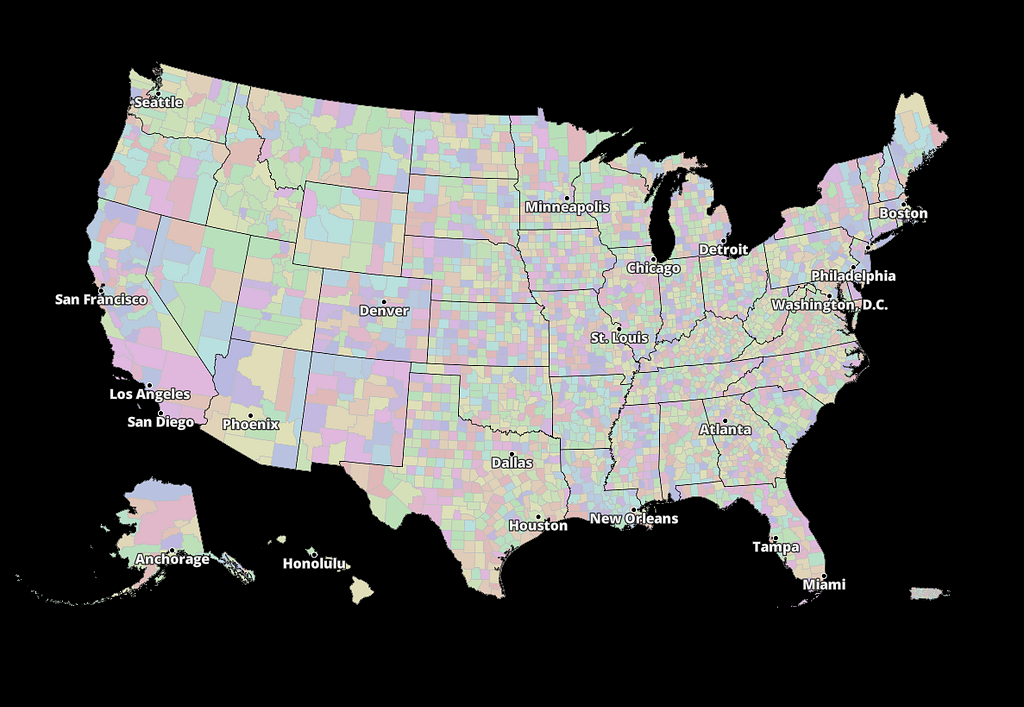
Once the file has finished processing, you will want to add it to a blank style. Here is why:
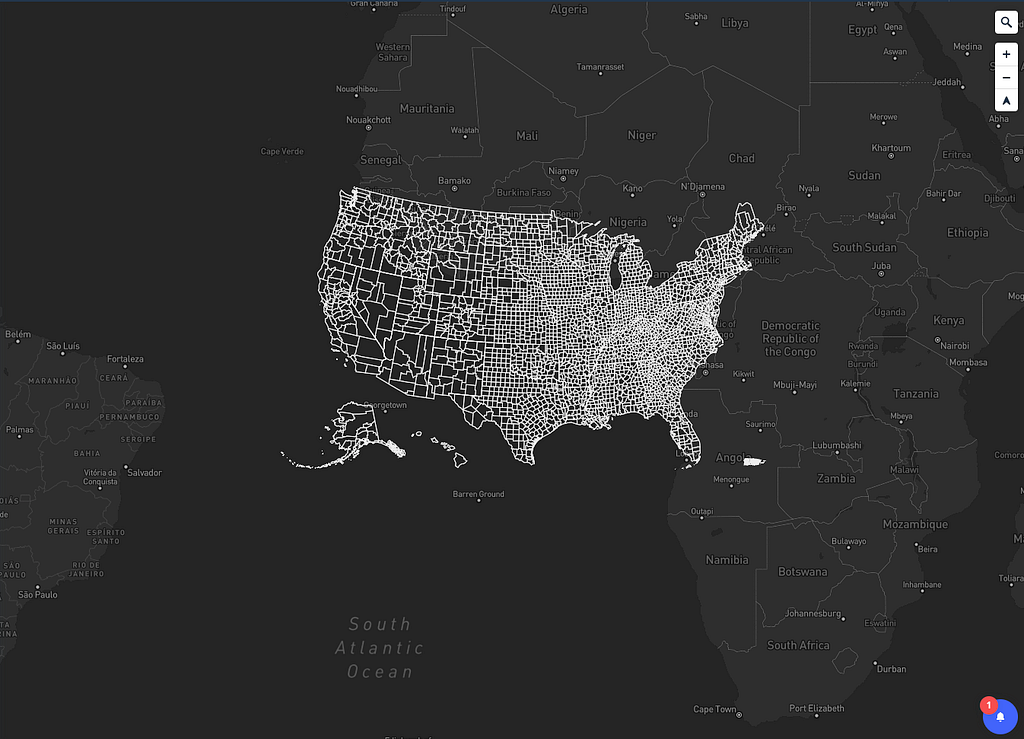
Yep, the US isn’t where it should be. Well, not really. Remember, this is Albers USA in a Mercator projection and therefore, the placement won’t match any of the Mapbox tilesets.
This is why you need to reproject anything that will need to be displayed on top of the United States, following the same technique described in this post. So for instance, if you wanted to add populated places, you would:
- Download the file from Natural Earth,
- Filter places to show only US places using Mapshaper
- Reproject the GeoJSON using Dirty Reprojector
- Upload to Mapbox or add it as a GeoJSON source using Mapbox GL JS
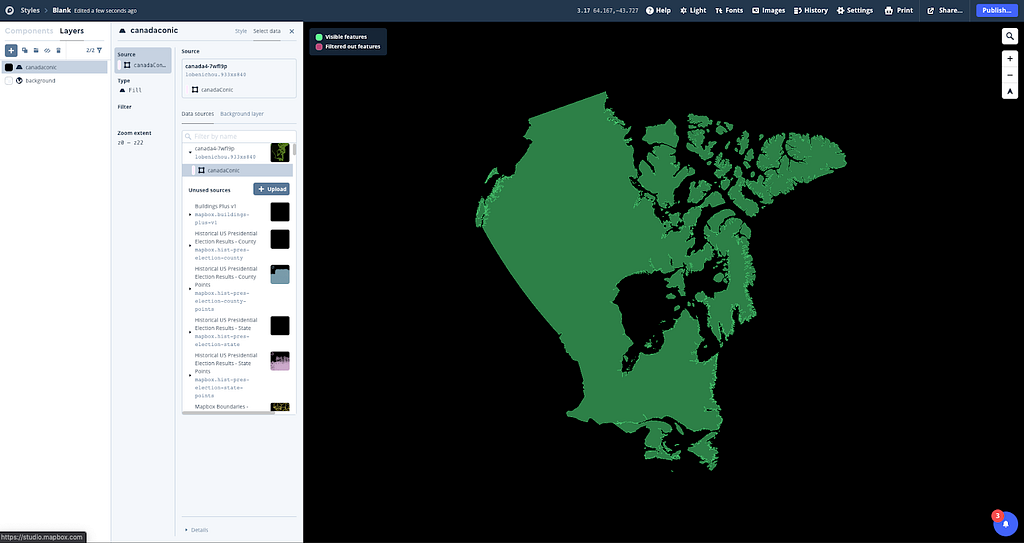
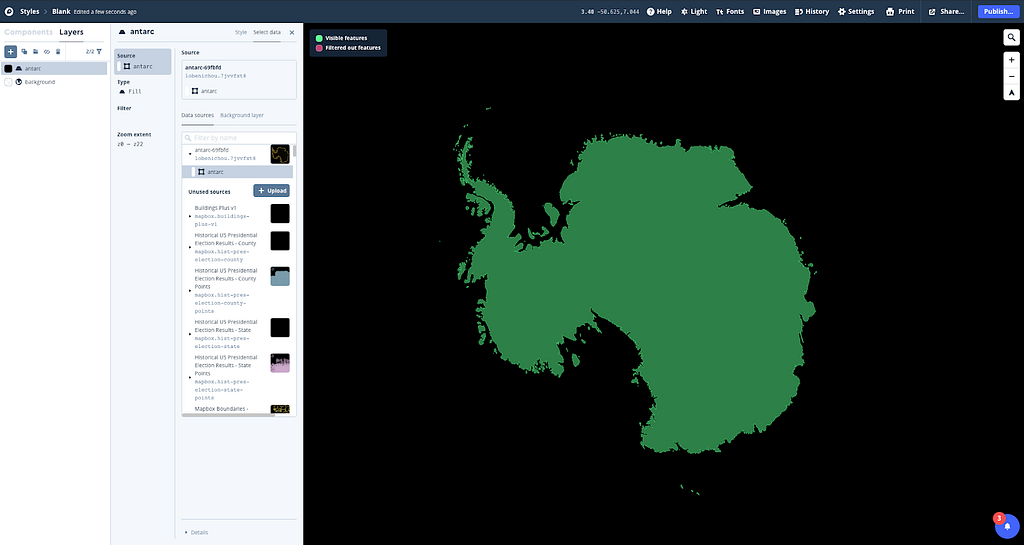
This technique can be repeated with a bunch of other projections. For example, Antarctica using a stereographic projection or Canada using a Lambert conformal conic projection:
While it has some limitations, this process allows for greater cartographic freedom and is especially efficient if you do not need Mapbox data like roads and streets. All your custom data can be reprojected and you can use Mapbox GL JS to add interactivity like hover, click, and zoom, or to join live data to the geometries on the fly using feature-state.
Build your own and tag your map on Twitter using #BuiltWithMapbox and as always, reach out with any questions to lo@mapbox.com or on Twitter, Lo Bénichou
Mapping the US elections: Guide to Albers USA projection in Studio was originally published in Points of interest on Medium, where people are continuing the conversation by highlighting and responding to this story.