Uber posted a loss of $1.07bn (£821m) in the three months to September, as the ride-sharing firm prepares for a public stock offering next year. The US company’s net losses widened sharply on a quarterly basis as revenues rose only slightly. Uber was recently valued at $72bn, making it one of the most valuable privately… Continue reading Uber loss tops $1bn ahead of planned IPO
Tag: Financial Results
Sixt shoots 158% profit until September by selling its stake in DriveNow
Posted 11/15/2018 11: 12: 54CET MADRID, 15 Nov. (EUROPA PRESS) – The car rental company Sixt closed the first nine months of the year with a net attributable profit of 390.17 million euros, representing an increase of 158% compared to the same period of the previous year, according to data published by the company. The… Continue reading Sixt shoots 158% profit until September by selling its stake in DriveNow
UPDATE 1-Uber posts $1 bln loss in quarter as growth in bookings slows
SAN FRANCISCO (Reuters) – Uber Technologies Inc said on Wednesday that growth in bookings for its ride-hailing and delivery services rose 6 percent in the latest quarter, the third quarter in a row that growth has remained in the single digits after double-digit growth for all of last year. FILE PHOTO: The Uber application is… Continue reading UPDATE 1-Uber posts $1 bln loss in quarter as growth in bookings slows
UK used car market remains strong with more than 2 million changing hands in Q3
UK used car market remains strong – more than 6 million transactions in the year to date, supported by busy summer… https://t.co/4tqS964G3E
Mahindra & Mahindra Financial Results- 2Q, FY-2019
Mahindra & Mahindra Financial Results- 2Q, FY-2019
Q2 M&M + MVML Revenue at Rs. 12790 crores up by 6%
Q2 M&M + MVML PAT after (EI) at Rs.1779 crores up by 26%
Mumbai, 14th November 2018: The Board of Directors of Mahindra & Mahindra Limited today announced the financial results for the quarter ended 30th September 2018 of the Company and the consolidated Mahindra Group.
Q2 F2019 – M&M + MVML* Results
Rs. crores
Q2 F2019
Q2 F2018
Growth % YoY
Revenues and Other Income
13,638
12,574
8%
Profit from ordinary activities Before Tax (before EI)
2,161
2,035
6%
Profit from ordinary activities Before Tax (after EI)
2,298
2,035
13%
Profit from ordinary activities After Tax (after EI)
1,779
1,411
26%
Operating margin (OPM)
14.5%
16.0%
Vehicles sold (Nos)
1,41,163
129,754
9%
Tractors sold (Nos)
73,012
76,984
-5%
Exports (vehicles and tractors) (Nos)
13,377
11,755
14%
For Q2 F2019, the Indian auto industry (excluding two wheelers) posted a moderate growth of 4.8%. This moderation in growth was due to a high base from Q2 F2018, shift of the festive season to Q3 F2019 and partial slowing down of demand for passenger vehicles especially in urban parts of the country. The passenger vehicle industry reported a de-growth of 3.6%, with the utility vehicle de-growing 8.1%. The commercial vehicle goods industry posted a robust growth of 29.8%, with LCV < 3.5T goods segment growing 31.3% and the MHCV goods segment grew 29.5%. The demand in the LCV < 3.5T segment was driven by a strong rural demand coming from the agri sector and sustained efforts for rural development coupled with affordable finance. The MHCV segment growth is driven by sustained investment in road, infra projects and an uptick in IIP. In Q2 F2019, the total domestic automotive volume for the Company grew by 8.8% and the HCV volume with sales of 3078 trucks grew by 48.1%. The Company exported 9,244 vehicles during the current quarter, a growth of 18.9% over the corresponding quarter previous year.
The domestic tractor industry witnessed a decline of 2.6% in Q2 F2019 on account of shift in festive season to Q3 F2019 which resulted in the company’s domestic tractor sales also declining by 5.2% in Q2 F2019. With the healthy reservoir levels, progress on rabi sowing and increase in minimum support prices of Rabi crops we expect the growth momentum to pick up in the coming months.
Outlook:
Real GDP growth, according to the RBI's estimates, is projected to improve from 6.7 per cent in 2017-18 to 7.4 per cent in 2018-19. Rising gross fixed capital formation, driven by the government’s focus on the road sector and affordable housing along with higher private spending has helped buoy growth so far. The monsoon was marked by an overall deficit of 9 per cent but distribution of precipitation remained conducive along with higher water reservoir levels. Therefore, the first advance estimates of production of kharif crops for 2018-19 have placed food grains production being 0.6 per cent higher than last year’s level.
Going forward, growth will be a function of evolving liquidity conditions as well as private and government spending. Among global factors, crude oil price behaviour and US-China trade policy maneuvering will be the key factors to watch out for.
H1 F2019 – M&M + MVML Results
Rs. crores
H1 F2019
H1 F2018
Growth % YoY
Revenues and Other Income
27,189
23,580
15%
Profit from ordinary activities Before Tax (before EI)
3,991
3,165
26%
Profit from ordinary activities Before Tax (after EI)
4,153
3,165
31%
Profit from ordinary activities After Tax (after EI)
3,036
2,163
40%
Operating margin (OPM)
15.1%
14.7%
Q2 & H1 F2019 – M&M Standalone Results
Rs. crores
Q2 F2019
Q2 F2018
H1 F2019
H1 F2018
Revenues and Other Income
13,835
12,745
27,620
25,326
Profit from ordinary activities After Tax (after EI)
1,649
1,332
2,870
2,081
Q2 & H1 F2019 – Group Consolidated Results
Rs. crores
Q2 F2019
Q2 F2018
Growth % YoY
H1 F2019
H1 F2018
Growth % YoY
Revenues and Other Income
26,125
22,725
15%
52,386
45,937
14%
Profit after tax after Non-Controlling Interest (before EI and one-off items)
1,075
988
9%
2,456
1,845
33%
Profit after tax after Non-Controlling Interest (after EI and one-off items)
1,633
2,029
-20%
3,363
2,886
17%
A full summation of Gross Revenues and other income of all the group companies taken together for the half year ended 30th September 2018 is Rs. 70,934 crores (USD 10.6 billion).
Note: Translation of rupee to dollar is a convenience translation at the average exchange rate for the twelve-month period ended 30th September 2018.
About Mahindra
The Mahindra Group is a USD 20.7 billion federation of companies that enables people to rise through innovative mobility solutions, driving rural prosperity, enhancing urban living, nurturing new businesses and fostering communities. It enjoys a leadership position in utility vehicles, information technology, financial services and vacation ownership in India and is the world’s largest tractor company, by volume. It also enjoys a strong presence in agribusiness, aerospace, commercial vehicles, components, defense, logistics, real estate, renewable energy, speedboats and steel, amongst other businesses. Headquartered in India, Mahindra employs over 2,40,000 people across 100 countries.
Learn more about Mahindra on www.mahindra.com / Twitter and Facebook: @MahindraRise
Media contact information
Mohan Nair
Vice President (Communications)
Mahindra & Mahindra Ltd.
Landline – + 91 22 28468510
Email – nair.mohan@mahindra.com
SK Innovation mulls building car battery plants in U.S., Europe

SEOUL, Nov. 14 (Yonhap) — SK Innovation Co., a South Korean energy-to-construction conglomerate, said Wednesday that it is considering building electric vehicle battery plants in the United States and Europe to meet growing demand for zero-emissions cars. SK Innovation said up to four unidentified areas have been shortlisted for its first plant in the U.S.… Continue reading SK Innovation mulls building car battery plants in U.S., Europe
Tesla: We Are Improving The Design Of Our Battery Cell
4 H BY MARK KANE Production lines, battery modules and cells are evolving Tesla distinguishes itself from other manufacturers because it constantly upgrades its cars (others apply changes in packages every few years). That same policy Tesla utilizes in other areas like battery production at the Gigafactory. According to Tesla’s President of Automotive, Jerome Guillen,… Continue reading Tesla: We Are Improving The Design Of Our Battery Cell
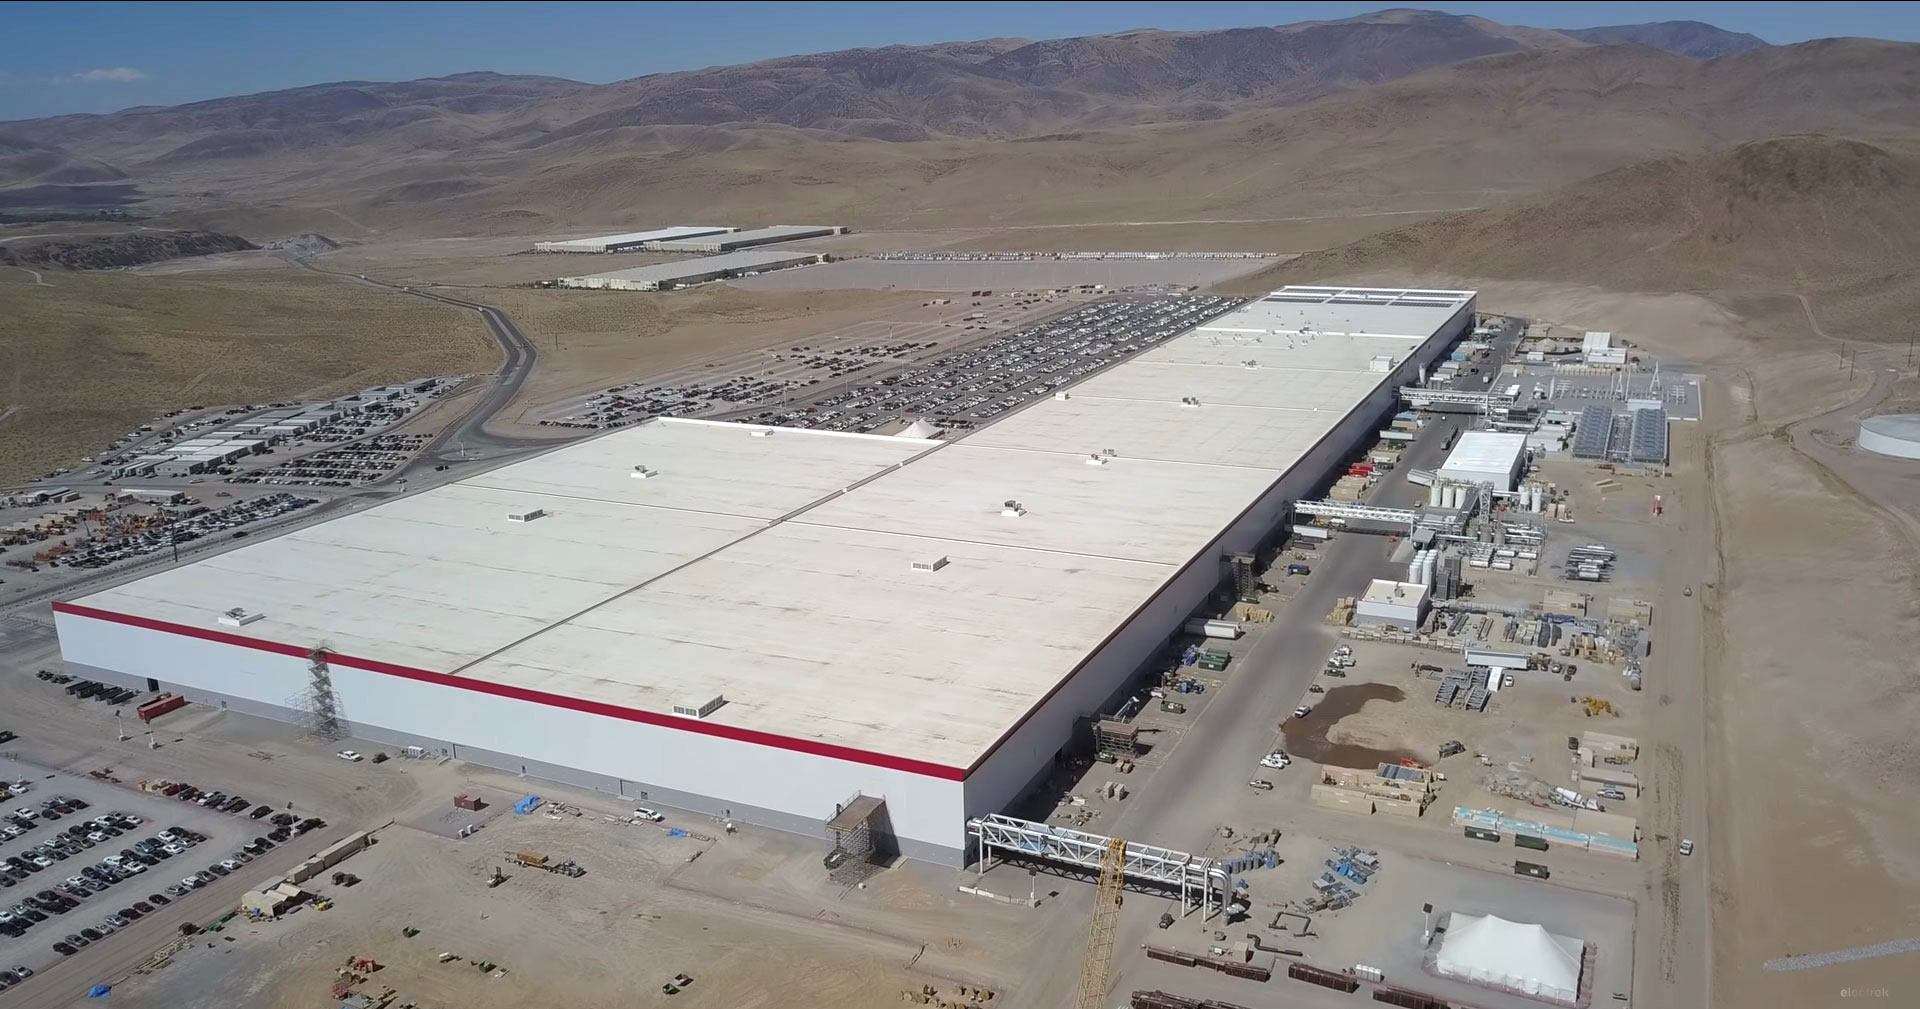
A look inside Tesla’s Gigafactory: The key to the automakers’ success
An inside look at Tesla's Gigafactory
1 Hour Ago | 03:31
Walk into Tesla's Gigafactory in Sparks, Nevada, and the first thing that stands out is the size of the battery plant. It's enormous. So big that you could fit 33 football fields — and it's only getting larger.
“The Gigafactory is critical to Tesla. There is more batteries produced here for electric vehicles than in the rest of the planet combined. We would not be able to make all the vehicles we are making now if we didn't have the Gigafactory,” said Jerome Guillen, president of Tesla Automotive.
The Gigafactory's expansion since opening in July 2016 has been critical to Tesla's growth. This year, the automaker is on track to sell 170,000 vehicles, a jump of more than 59 percent compared to last year. Much of that growth is due to its latest vehicle, the Model 3, a sedan targeted to a broader audience than Tesla's previous cars. All of the Model 3's batteries are built at the Gigafactory.
Last quarter, as Tesla hit its target of producing more than 5,000 Model 3 cars per week, the company posted a profit. CEO Elon Musk says his company has turned the corner after years of mounting losses.
Meghan Reeder | CNBC
Workers at the Tesla Gigafactory.
“We expect to again have positive net income and cash flow in Q4 and I believe, our aspiration certainly will be for all quarters going forward,” Musk told analysts during the company's earnings conference call.
Analysts are not so sure. “Part of the real reason they beat in Q3 is because the mix was so strong,” said Colin Langan, an auto analyst for UBS who has a sell rating on Tesla. Langan calculates the average Tesla sold for more than $60,000 last quarter, well above the price point Tesla initially promised potential buyers.
“I think long-term the price will probably settle in the mid-forties, where comparable luxury vehicles sell today, and that is going to put a lot of margin pressure on over time,” he said.
Easing that pressure and keeping Tesla profitable will come down to a few key factors, most notably, growing sales and lowering the cost to build battery packs. In both cases, the Gigafactory will determine if Tesla succeeds.
Running around the clock, the Gigafactory cranks out approximately two battery packs every minute. Its production is currently estimated to be 5,000 a week, with room to grow, according to Sam Jaffe, managing director with Cairn Energy Research Advisors in Boulder, Colorado.
Meghan Reeder | CNBC
Workers at the Tesla Gigafactory.
Jaffe studies the electric vehicle market, specifically focusing on the costs to build the battery packs and cells that provide the energy inside those packs. Jaffe's analysis pegs Tesla's cost to manufacture a battery cell at $116 per kilowatt-hour, which he says is “far ahead of the industry.” He estimates other automakers building electric vehicles have battery cell costs closer to $146 per kilowatt-hour.
“Tesla has shown an ability and a drive to reduce both cell costs and battery pack costs,” he said. “They have been planning for this moment, with this tremendous cost advantage, for a long time, and in general they have executed well on it.”
That's not to say, there haven't been growing pains at the Gigafactory. From having to backtrack on overly ambitious plans to use robotics and automation to allegations the plant is being wasteful, Tesla's battery plant has faced plenty of scrutiny.
Meghan Reeder | CNBC
Workers at the Tesla Gigafactory.
Guillen said he believes the Gigafactory is just tapping its potential for battery production.
“The costs have come down and continue to come down a lot and that has enabled us to reach profitability in the last quarter and positive cash flow as well,” he said.
—CNBC's Meghan Reeder contributed to this report.
Data could be what Ford sells next as it looks for new revenue
Original Article
Revision of Performance Projection for the First Half of the Fiscal Year Ending 2019 (from April 1 to September 30, 2018)
October 23, 2018
Revision of Performance Projection
for the First Half of the Fiscal Year Ending 2019 (from April 1 to September 30, 2018)
Company name: SUBARU CORPORATION
Representative: Tomomi Nakamura, Representative Director, President and CEO
Code number: 7270 (First Section of Tokyo Stock Exchange)
Contact for inquiries: Katsuo Saito, Vice President
and General Manager of Administration Department
Phone: +81-3-6447-8825
Considering the current business trend, Subaru Corporation has announced the revision of performance projection for the first half of the fiscal year ending March 31, 2019 (from April 1 to September 30, 2018) which was released at the timing of consolidated financial results announcement on August 6, 2018.
1. Revision of consolidated basis performance projection for the first half of the fiscal year 2019
(from April 1 to September 30, 2018)
Net sales
Operating Income
Ordinary Income
Net Income*
Net Income
Per Share
Previous projection (A)
Millions of yen
1,463,100
Millions of yen
110,000
Millions of yen
111,700
Millions of yen
79,100
Yen
103.17
Revised projection (B)
1,486,000
61,000
66,000
49,000
63.91
Increase and decrease (B-A)
22,900
(49,000)
(45,700)
(30,100)
Change of percentage (%)
1.6
(44.5)
(40.9)
(38.1)
Actual results of the first half of
the fiscal 2018 (ended
September 30, 2017)
1,608,013
212,125
212,726
85,005
110.87
*Net income attributable to owners of parent
Note: The Company has changed its accounting policies with effect from the first quarter of FYE 2019. Accordingly, the new policies have been retroactively applied to FYE 2018 results before carrying out year-on-year comparison and analysis of net sales figures.
2. Reasons for the Changes
The Company has revised the consolidated performance projection for the first half of fiscal year ending March 31, 2019 as above due mainly to quality-related expenses which offset foreign exchange gains.
The revised projection is based on assumed foreign exchange rates of ¥109/US$(previously ¥105/US$) and ¥131/EUR(previously ¥130/EUR).
Full-year consolidated performance projection for the fiscal year ending March 31, 2019 is currently under examination and will be published concurrent with the release of consolidated financial results for the first half scheduled for November 5, 2018.
3. Dividends
There is no revision of dividend forecast.
Note: Above mentioned projections are based on certain assumptions and our management’s judgment in light of currently available information, therefore actual results may differ from these projections.
###
[PDF/113 KB]